
- Startseite >
- Meteorologie >
- Relative Luftfeuchte >
- Obere Donau >
- Greimersdorf >
- Jahresgrafik

Jahresgrafik Greimersdorf
Relative Luftfeuchte vom 01.04.2019 bis zum 31.03.2020
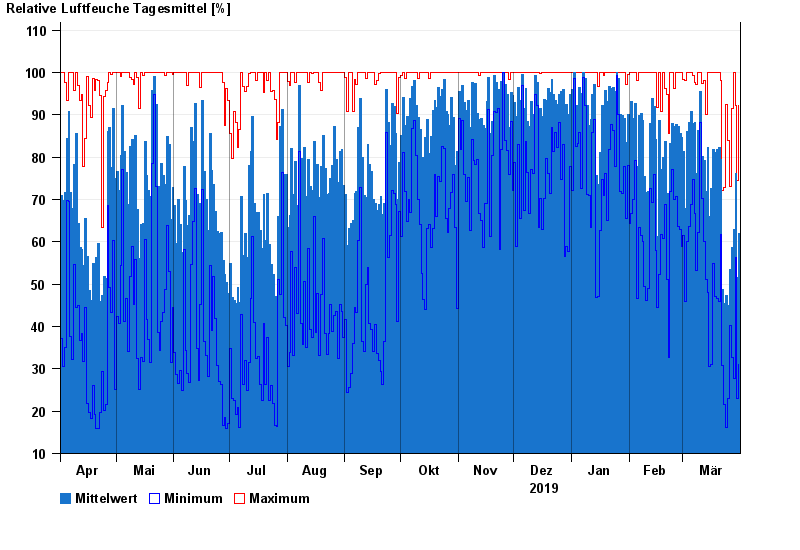
| Datum | Mittelwert [%] | Maximum [%] | Minimum [%] |
|---|---|---|---|
| 31.03.2020 | 61,9 | 92,2 | 31,0 |
| 30.03.2020 | 51,5 | 74,5 | 22,9 |
| 29.03.2020 | 76,1 | 92,1 | 56,2 |
| 28.03.2020 | 62,8 | 100,0 | 27,7 |
| 27.03.2020 | 58,6 | 91,6 | 32,7 |
| 26.03.2020 | 53,5 | 73,1 | 40,3 |
| 25.03.2020 | 44,9 | 84,0 | 23,0 |
© Bayerisches Landesamt für Umwelt 2024