
- Startseite >
- Meteorologie >
- Relative Luftfeuchte >
- Obere Donau >
- Freising >
- Jahresgrafik

Jahresgrafik Freising
Relative Luftfeuchte vom 28.11.2022 bis zum 27.11.2023
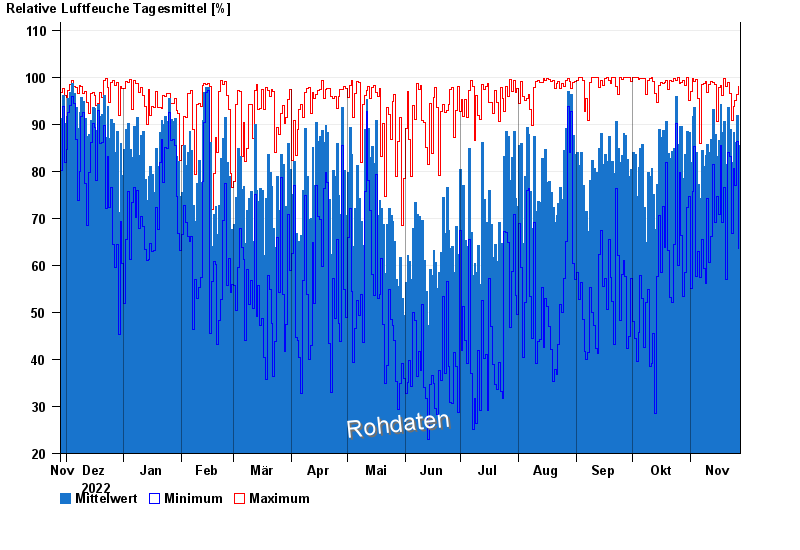
| Datum | Mittelwert [%] | Maximum [%] | Minimum [%] |
|---|---|---|---|
| 27.11.2023 | 85,5 | 98,0 | 63,5 |
| 26.11.2023 | 91,8 | 96,4 | 86,4 |
| 25.11.2023 | 86,2 | 95,1 | 77,0 |
| 24.11.2023 | 88,2 | 93,7 | 80,7 |
| 23.11.2023 | 81,8 | 90,8 | 66,8 |
| 22.11.2023 | 88,9 | 96,5 | 83,2 |
| 21.11.2023 | 93,5 | 98,8 | 84,0 |
© Bayerisches Landesamt für Umwelt 2024