
- Startseite >
- Meteorologie >
- Relative Luftfeuchte >
- Isar >
- Wartsteinkopf >
- Jahresgrafik

Jahresgrafik Wartsteinkopf
Relative Luftfeuchte vom 27.04.2024 bis zum 26.04.2025
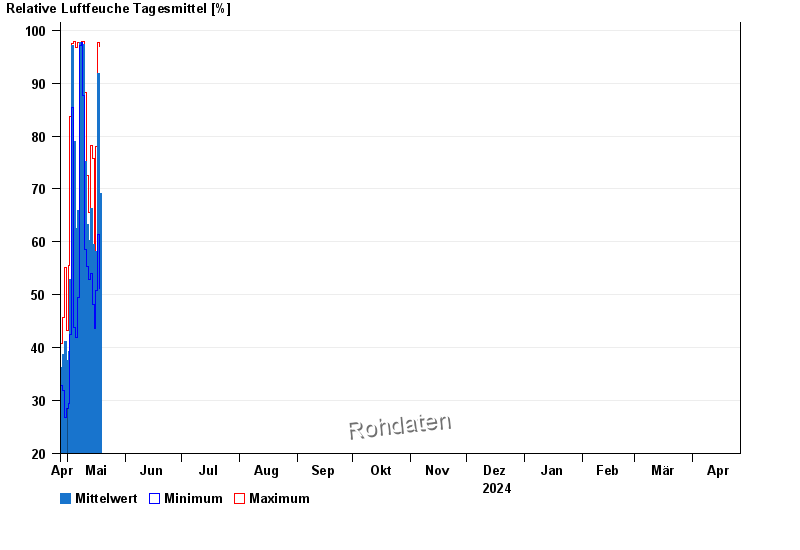
| Datum | Mittelwert [%] | Maximum [%] | Minimum [%] |
|---|---|---|---|
| 05.05.2024 | 50,5 | 71,2 | 41,9 |
| 04.05.2024 | 79,0 | 97,9 | 43,8 |
| 03.05.2024 | 97,2 | 97,4 | 85,3 |
| 02.05.2024 | 52,9 | 83,7 | 42,4 |
| 01.05.2024 | 39,2 | 55,6 | 29,4 |
| 30.04.2024 | 37,5 | 43,3 | 28,5 |
| 29.04.2024 | 41,1 | 55,1 | 26,8 |
© Bayerisches Landesamt für Umwelt 2024