
- Startseite >
- Meteorologie >
- Relative Luftfeuchte >
- Isar >
- Spitzingsee Freiland 1 >
- Jahresgrafik

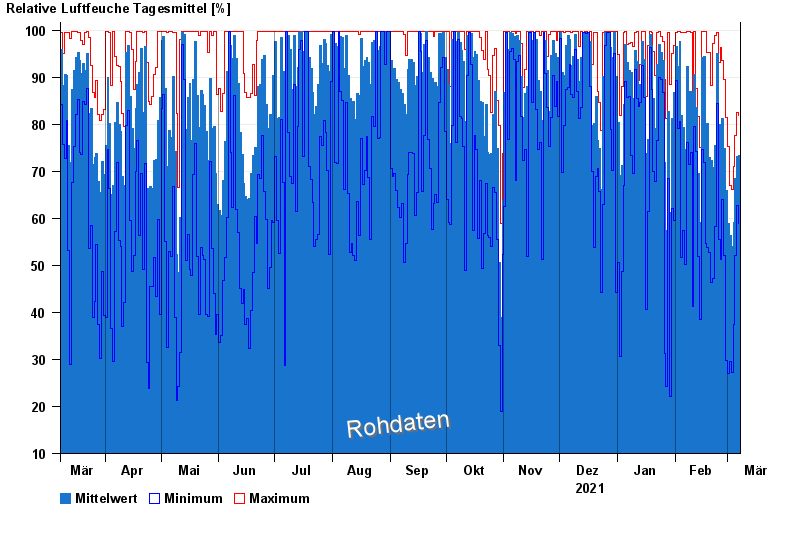
Jahresgrafik Spitzingsee Freiland 1
Relative Luftfeuchte vom 08.03.2021 bis zum 07.03.2022
| Datum | Mittelwert [%] | Maximum [%] | Minimum [%] |
|---|---|---|---|
| 07.03.2022 | 73,3 | 81,8 | 58,8 |
| 06.03.2022 | 73,1 | 82,5 | 62,8 |
| 05.03.2022 | 68,4 | 77,7 | 52,1 |
| 04.03.2022 | 59,1 | 71,1 | 37,5 |
| 03.03.2022 | 54,1 | 66,2 | 27,3 |
| 02.03.2022 | 56,4 | 67,0 | 29,5 |
| 01.03.2022 | 58,9 | 75,2 | 27,0 |
© Bayerisches Landesamt für Umwelt 2024