
- Startseite >
- Meteorologie >
- Relative Luftfeuchte >
- Isar >
- Schönharting >
- Jahresgrafik

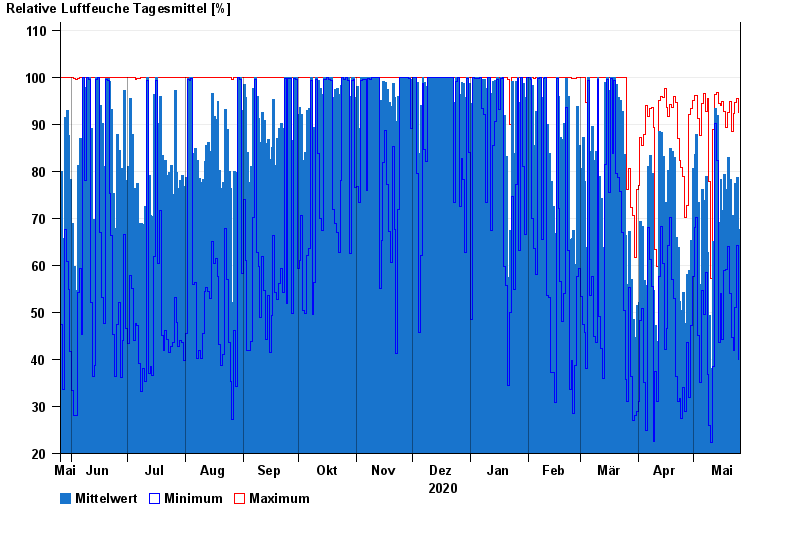
Jahresgrafik Schönharting
Relative Luftfeuchte vom 26.05.2020 bis zum 25.05.2021
| Datum | Mittelwert [%] | Maximum [%] | Minimum [%] |
|---|---|---|---|
| 25.05.2021 | 67,6 | 92,6 | 40,0 |
| 24.05.2021 | 78,7 | 95,5 | 64,2 |
| 23.05.2021 | 77,5 | 94,6 | 51,1 |
| 22.05.2021 | 68,0 | 92,2 | 42,0 |
| 21.05.2021 | 70,7 | 88,4 | 44,6 |
| 20.05.2021 | 78,3 | 94,9 | 54,0 |
| 19.05.2021 | 82,9 | 92,6 | 64,0 |
© Bayerisches Landesamt für Umwelt 2024