
- Startseite >
- Meteorologie >
- Relative Luftfeuchte >
- Isar >
- Schönharting >
- Jahresgrafik

Jahresgrafik Schönharting
Relative Luftfeuchte vom 22.10.2022 bis zum 21.10.2023
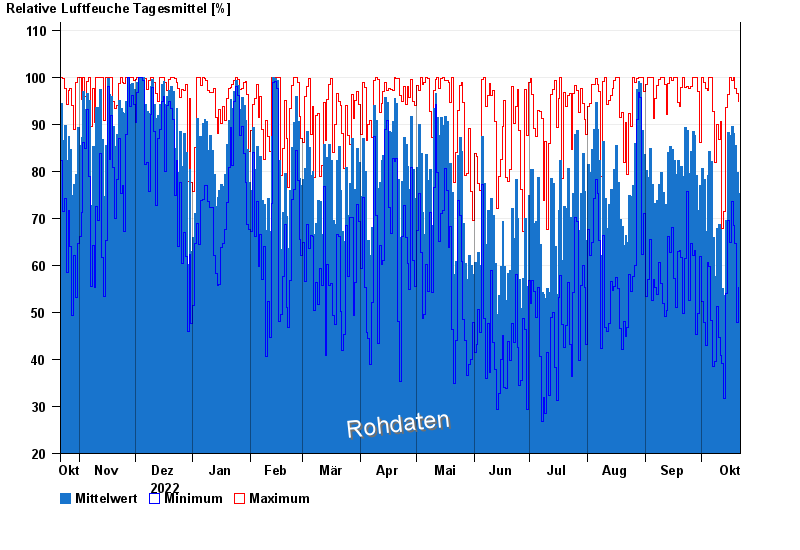
| Datum | Mittelwert [%] | Maximum [%] | Minimum [%] |
|---|---|---|---|
| 21.10.2023 | 75,3 | 94,8 | 55,2 |
| 20.10.2023 | 79,8 | 96,5 | 47,8 |
| 19.10.2023 | 85,5 | 97,5 | 64,7 |
| 18.10.2023 | 88,1 | 100,0 | 68,4 |
| 17.10.2023 | 89,6 | 99,4 | 73,6 |
| 16.10.2023 | 87,6 | 100,0 | 64,9 |
| 15.10.2023 | 88,2 | 96,3 | 69,6 |
© Bayerisches Landesamt für Umwelt 2024