
- Startseite >
- Meteorologie >
- Relative Luftfeuchte >
- Isar >
- Schönharting >
- Jahresgrafik

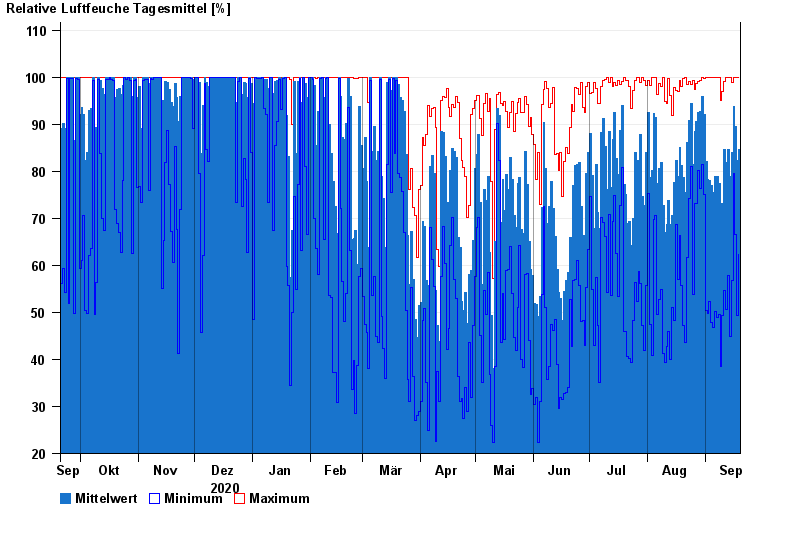
Jahresgrafik Schönharting
Relative Luftfeuchte vom 20.09.2020 bis zum 19.09.2021
| Datum | Mittelwert [%] | Maximum [%] | Minimum [%] |
|---|---|---|---|
| 19.09.2021 | 84,7 | 100,0 | 62,3 |
| 18.09.2021 | 82,2 | 100,0 | 49,4 |
| 17.09.2021 | 89,6 | 100,0 | 66,6 |
| 16.09.2021 | 93,7 | 100,0 | 79,6 |
| 15.09.2021 | 84,1 | 98,8 | 56,8 |
| 14.09.2021 | 78,9 | 100,0 | 44,8 |
| 13.09.2021 | 84,7 | 100,0 | 57,8 |
© Bayerisches Landesamt für Umwelt 2024