
- Startseite >
- Meteorologie >
- Relative Luftfeuchte >
- Isar >
- Schönharting >
- Jahresgrafik

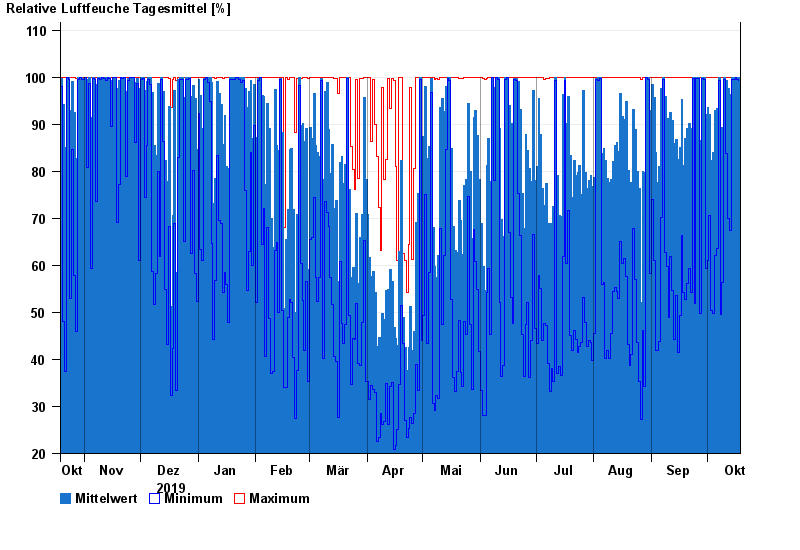
Jahresgrafik Schönharting
Relative Luftfeuchte vom 19.10.2019 bis zum 18.10.2020
| Datum | Mittelwert [%] | Maximum [%] | Minimum [%] |
|---|---|---|---|
| 18.10.2020 | 99,9 | 100,0 | 99,4 |
| 17.10.2020 | 99,9 | 100,0 | 99,5 |
| 16.10.2020 | 100,0 | 100,0 | 100,0 |
| 15.10.2020 | 99,9 | 100,0 | 99,5 |
| 14.10.2020 | 99,9 | 100,0 | 99,5 |
| 13.10.2020 | 96,4 | 100,0 | 67,4 |
| 12.10.2020 | 97,7 | 100,0 | 69,9 |
© Bayerisches Landesamt für Umwelt 2024