
- Startseite >
- Meteorologie >
- Relative Luftfeuchte >
- Isar >
- Schönharting >
- Jahresgrafik

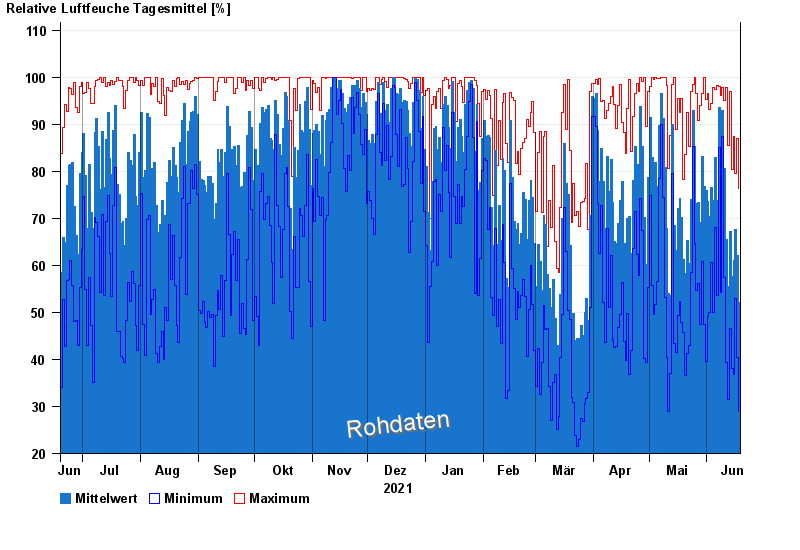
Jahresgrafik Schönharting
Relative Luftfeuchte vom 19.06.2021 bis zum 18.06.2022
| Datum | Mittelwert [%] | Maximum [%] | Minimum [%] |
|---|---|---|---|
| 18.06.2022 | 52,0 | 76,3 | 29,0 |
| 17.06.2022 | 62,0 | 87,0 | 40,4 |
| 16.06.2022 | 67,6 | 79,5 | 52,9 |
| 15.06.2022 | 61,1 | 87,4 | 36,7 |
| 14.06.2022 | 57,7 | 80,4 | 38,0 |
| 13.06.2022 | 67,3 | 97,0 | 46,6 |
| 12.06.2022 | 55,6 | 85,4 | 31,5 |
© Bayerisches Landesamt für Umwelt 2024