
- Startseite >
- Meteorologie >
- Relative Luftfeuchte >
- Isar >
- Schönharting >
- Jahresgrafik

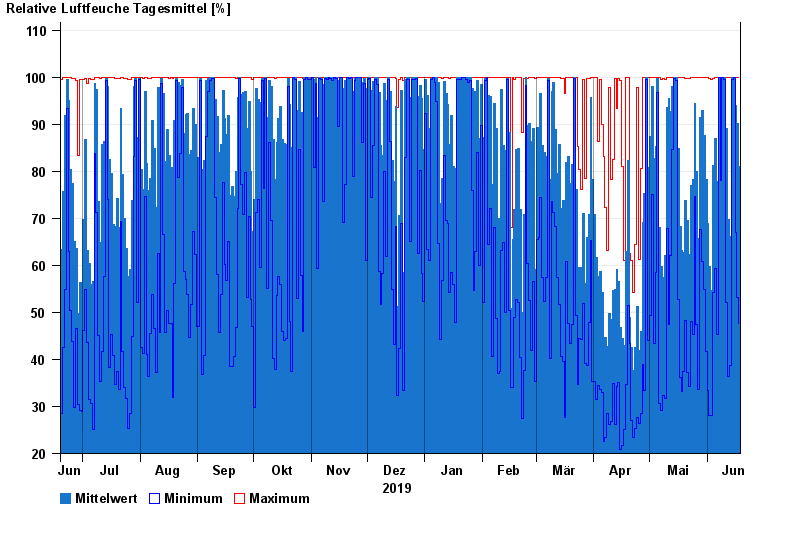
Jahresgrafik Schönharting
Relative Luftfeuchte vom 19.06.2019 bis zum 18.06.2020
| Datum | Mittelwert [%] | Maximum [%] | Minimum [%] |
|---|---|---|---|
| 18.06.2020 | 81,1 | 100,0 | 47,6 |
| 17.06.2020 | 90,1 | 100,0 | 53,1 |
| 16.06.2020 | 94,0 | 100,0 | 67,0 |
| 15.06.2020 | 100,0 | 100,0 | 100,0 |
| 14.06.2020 | 100,0 | 100,0 | 99,6 |
| 13.06.2020 | 66,1 | 100,0 | 38,8 |
| 12.06.2020 | 69,8 | 100,0 | 36,3 |
© Bayerisches Landesamt für Umwelt 2024