
- Startseite >
- Meteorologie >
- Relative Luftfeuchte >
- Isar >
- Schönharting >
- Jahresgrafik

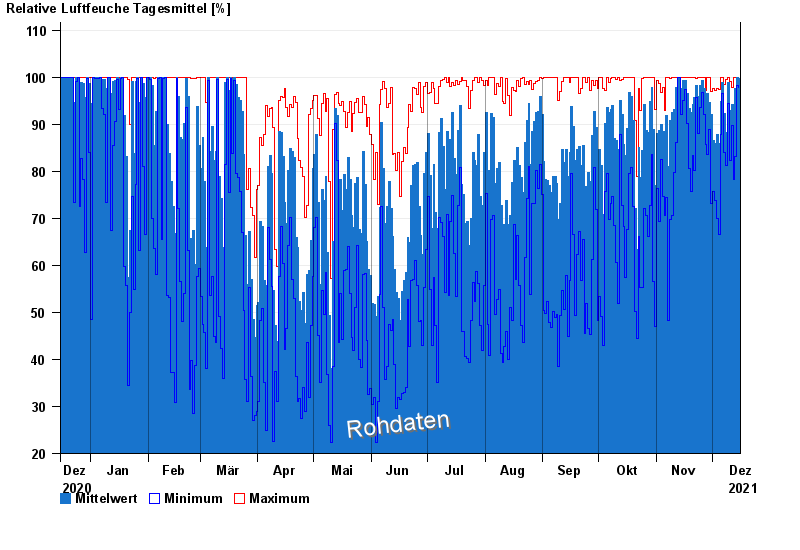
Jahresgrafik Schönharting
Relative Luftfeuchte vom 16.12.2020 bis zum 15.12.2021
| Datum | Mittelwert [%] | Maximum [%] | Minimum [%] |
|---|---|---|---|
| 15.12.2021 | 99,7 | 100,0 | 97,9 |
| 14.12.2021 | 99,9 | 100,0 | 98,2 |
| 13.12.2021 | 97,7 | 100,0 | 83,1 |
| 12.12.2021 | 90,4 | 100,0 | 78,2 |
| 11.12.2021 | 94,3 | 97,9 | 89,7 |
| 10.12.2021 | 92,9 | 99,1 | 82,2 |
| 09.12.2021 | 98,8 | 100,0 | 94,4 |
© Bayerisches Landesamt für Umwelt 2024