
- Startseite >
- Meteorologie >
- Relative Luftfeuchte >
- Isar >
- Schönharting >
- Jahresgrafik

Jahresgrafik Schönharting
Relative Luftfeuchte vom 06.06.2023 bis zum 05.06.2024
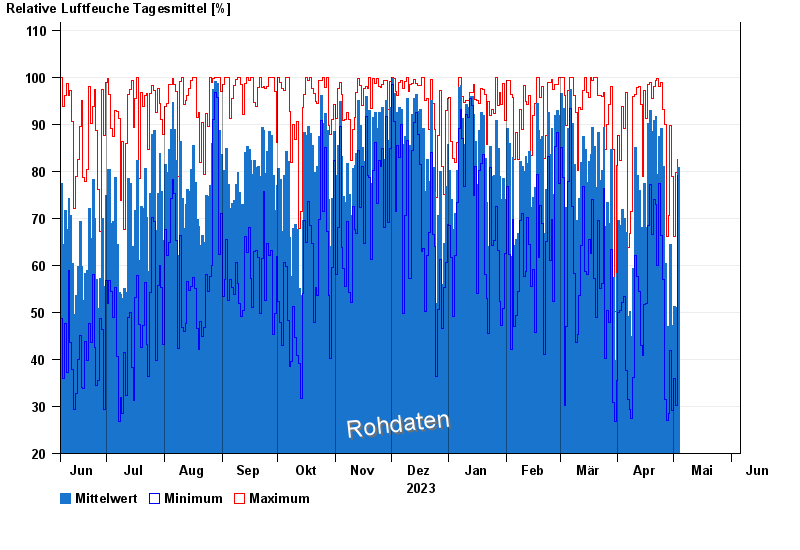
| Datum | Mittelwert [%] | Maximum [%] | Minimum [%] |
|---|---|---|---|
| 19.04.2024 | 87,5 | 95,4 | 66,6 |
| 18.04.2024 | 93,0 | 98,9 | 77,1 |
| 17.04.2024 | 90,2 | 98,5 | 68,4 |
| 16.04.2024 | 68,1 | 91,2 | 51,9 |
| 15.04.2024 | 77,4 | 97,2 | 51,6 |
| 14.04.2024 | 57,1 | 78,8 | 40,9 |
| 13.04.2024 | 68,1 | 94,2 | 43,0 |
© Bayerisches Landesamt für Umwelt 2024