
- Startseite >
- Meteorologie >
- Relative Luftfeuchte >
- Isar >
- Schönharting >
- Jahresgrafik

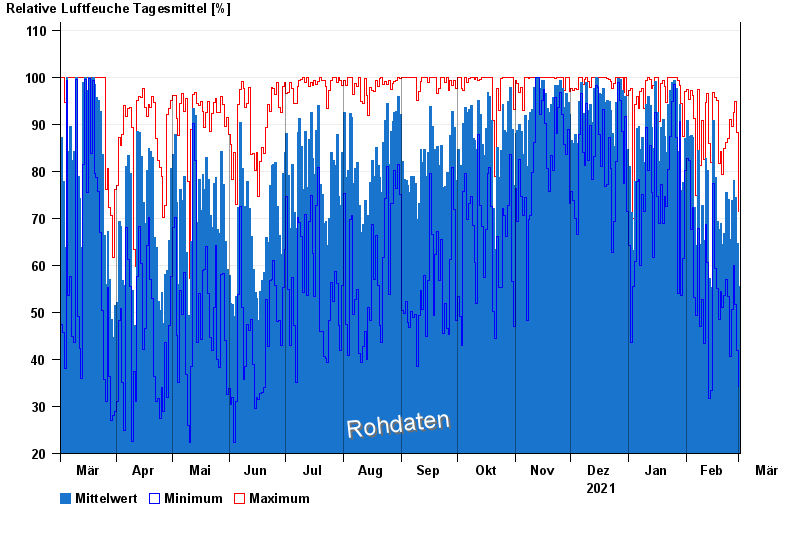
Jahresgrafik Schönharting
Relative Luftfeuchte vom 02.03.2021 bis zum 01.03.2022
| Datum | Mittelwert [%] | Maximum [%] | Minimum [%] |
|---|---|---|---|
| 01.03.2022 | 55,5 | 71,5 | 34,3 |
| 28.02.2022 | 64,6 | 88,3 | 41,8 |
| 27.02.2022 | 74,4 | 94,9 | 51,7 |
| 26.02.2022 | 78,0 | 92,5 | 60,0 |
| 25.02.2022 | 73,7 | 89,6 | 50,7 |
| 24.02.2022 | 65,5 | 91,1 | 40,6 |
| 23.02.2022 | 74,1 | 86,9 | 53,4 |
© Bayerisches Landesamt für Umwelt 2024