
- Startseite >
- Meteorologie >
- Relative Luftfeuchte >
- Isar >
- Rödental-Schönstädt (Speicher) >
- Jahresgrafik

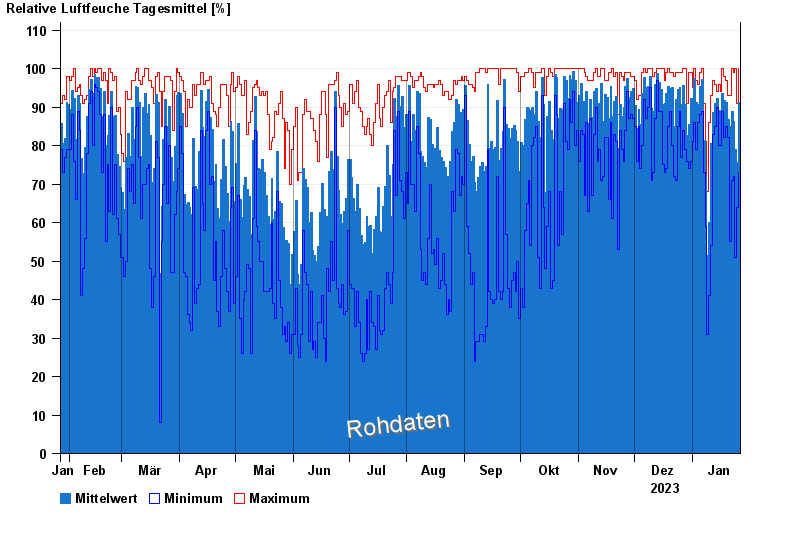
Jahresgrafik Rödental-Schönstädt (Speicher)
Relative Luftfeuchte vom 27.01.2023 bis zum 26.01.2024
| Datum | Mittelwert [%] | Maximum [%] | Minimum [%] |
|---|---|---|---|
| 26.01.2024 | 91,3 | 100,0 | 73,0 |
| 25.01.2024 | 75,5 | 91,0 | 64,0 |
| 24.01.2024 | 79,0 | 100,0 | 51,0 |
| 23.01.2024 | 86,3 | 99,0 | 72,0 |
| 22.01.2024 | 88,8 | 100,0 | 71,0 |
| 21.01.2024 | 85,0 | 93,0 | 55,0 |
| 20.01.2024 | 86,8 | 93,0 | 82,0 |
© Bayerisches Landesamt für Umwelt 2024