
- Startseite >
- Meteorologie >
- Relative Luftfeuchte >
- Isar >
- Obersöchering >
- Jahresgrafik

Jahresgrafik Obersöchering
Relative Luftfeuchte vom 24.01.2021 bis zum 23.01.2022
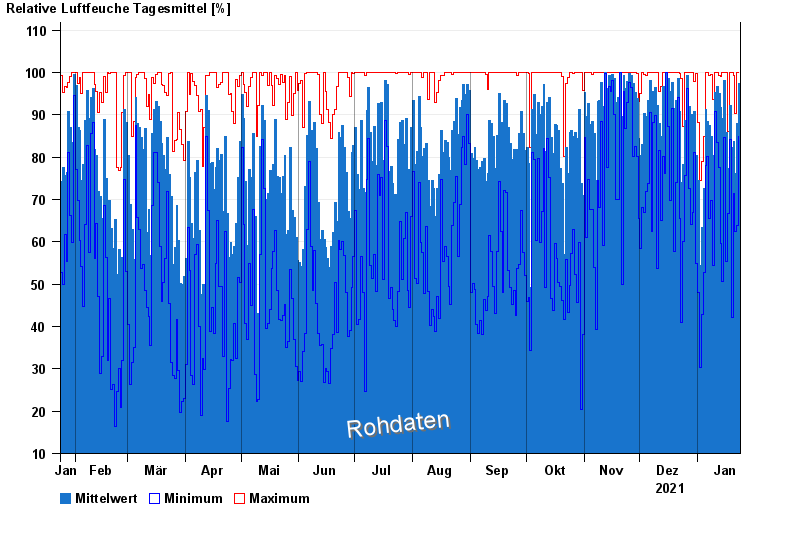
| Datum | Mittelwert [%] | Maximum [%] | Minimum [%] |
|---|---|---|---|
| 23.01.2022 | 97,3 | 100,0 | 84,8 |
| 22.01.2022 | 88,0 | 100,0 | 63,8 |
| 21.01.2022 | 76,1 | 90,4 | 62,4 |
| 20.01.2022 | 83,8 | 99,3 | 71,4 |
| 19.01.2022 | 82,2 | 100,0 | 42,1 |
| 18.01.2022 | 92,2 | 100,0 | 84,2 |
| 17.01.2022 | 77,3 | 86,1 | 66,8 |
© Bayerisches Landesamt für Umwelt 2024