
- Startseite >
- Meteorologie >
- Relative Luftfeuchte >
- Isar >
- Obersöchering >
- Jahresgrafik

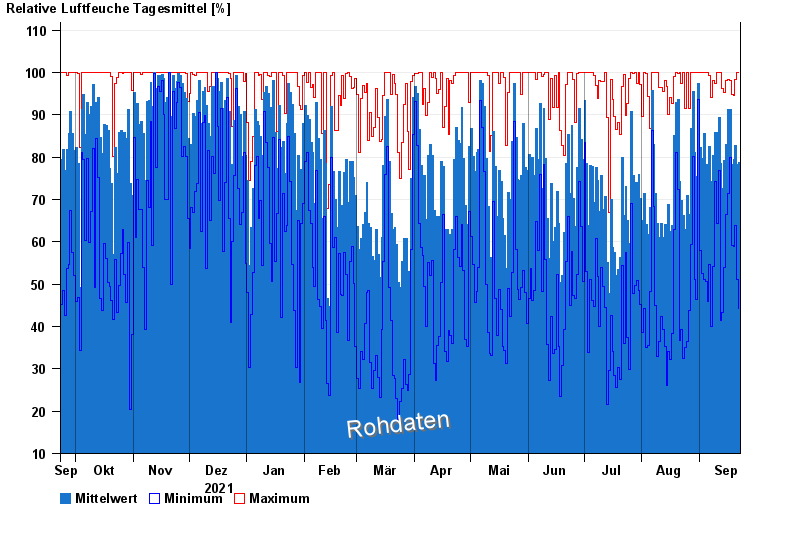
Jahresgrafik Obersöchering
Relative Luftfeuchte vom 23.09.2021 bis zum 22.09.2022
| Datum | Mittelwert [%] | Maximum [%] | Minimum [%] |
|---|---|---|---|
| 22.09.2022 | 78,8 | 100,0 | 44,2 |
| 21.09.2022 | 78,3 | 100,0 | 51,0 |
| 20.09.2022 | 82,7 | 98,4 | 63,9 |
| 19.09.2022 | 79,5 | 94,5 | 59,0 |
| 18.09.2022 | 78,2 | 94,8 | 59,2 |
| 17.09.2022 | 91,3 | 98,0 | 80,0 |
| 16.09.2022 | 91,3 | 98,3 | 71,4 |
© Bayerisches Landesamt für Umwelt 2024