
- Startseite >
- Meteorologie >
- Relative Luftfeuchte >
- Isar >
- Obersöchering >
- Jahresgrafik

Jahresgrafik Obersöchering
Relative Luftfeuchte vom 01.01.2017 bis zum 31.12.2017
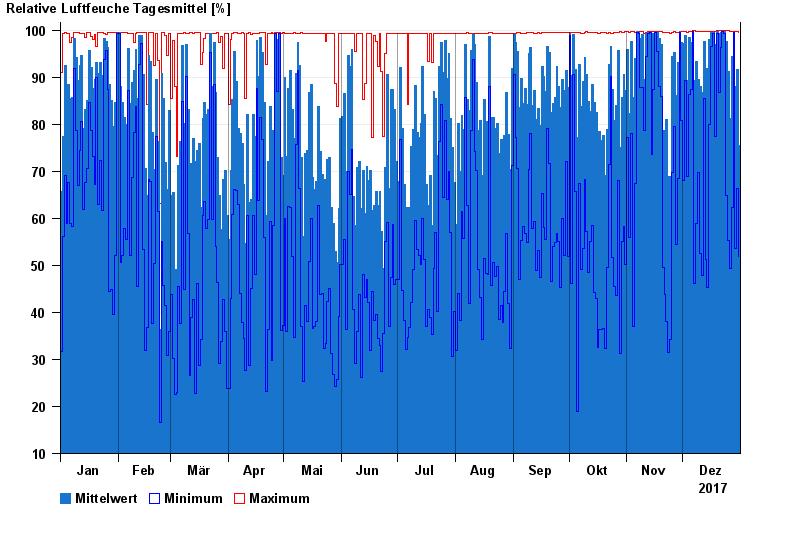
| Datum | Mittelwert [%] | Maximum [%] | Minimum [%] |
|---|---|---|---|
| 31.12.2017 | 75,4 | 99,5 | 51,9 |
| 30.12.2017 | 91,6 | 99,7 | 66,3 |
| 29.12.2017 | 88,1 | 99,8 | 53,6 |
| 28.12.2017 | 99,6 | 99,8 | 99,5 |
| 27.12.2017 | 94,5 | 99,8 | 62,4 |
| 26.12.2017 | 81,3 | 99,8 | 49,3 |
| 25.12.2017 | 91,2 | 99,9 | 55,2 |
© Bayerisches Landesamt für Umwelt 2024