
- Startseite >
- Meteorologie >
- Relative Luftfeuchte >
- Isar >
- Karlshuld >
- Jahresgrafik

Jahresgrafik Karlshuld
Relative Luftfeuchte vom 12.07.2018 bis zum 11.07.2019
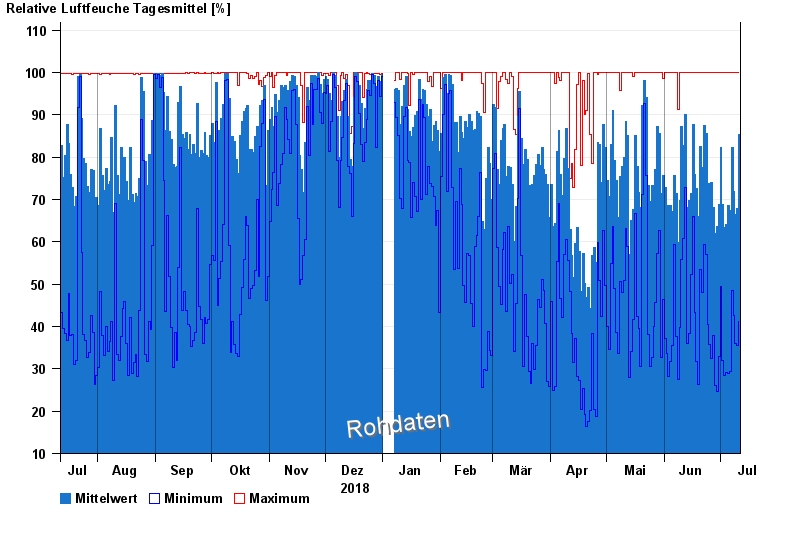
Hinweis: Die Zeitreihe im gewählten Zeitraum weist Lücken auf.
| Datum | Mittelwert [%] | Maximum [%] | Minimum [%] |
|---|---|---|---|
| 11.07.2019 | 85,3 | 100,0 | 41,3 |
| 10.07.2019 | 67,8 | 100,0 | 35,4 |
| 09.07.2019 | 66,5 | 100,0 | 36,0 |
| 08.07.2019 | 71,9 | 100,0 | 42,6 |
| 07.07.2019 | 82,2 | 100,0 | 48,5 |
| 06.07.2019 | 67,4 | 100,0 | 29,3 |
| 05.07.2019 | 68,5 | 100,0 | 28,9 |
© Bayerisches Landesamt für Umwelt 2024