
- Startseite >
- Meteorologie >
- Relative Luftfeuchte >
- Isar >
- Geretsried (Klima) >
- Jahresgrafik

Jahresgrafik Geretsried (Klima)
Relative Luftfeuchte vom 17.10.2022 bis zum 16.10.2023
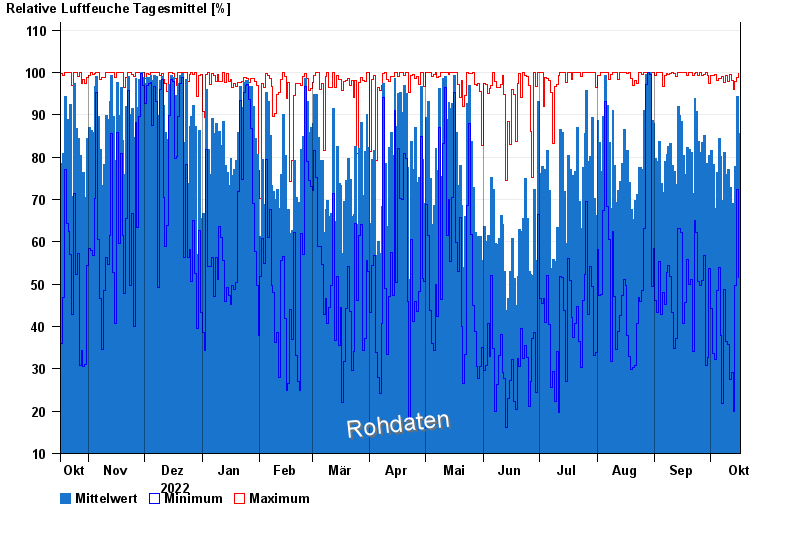
| Datum | Mittelwert [%] | Maximum [%] | Minimum [%] |
|---|---|---|---|
| 16.10.2023 | 85,7 | 99,7 | 51,6 |
| 15.10.2023 | 94,3 | 98,8 | 72,3 |
| 14.10.2023 | 77,8 | 97,9 | 49,6 |
| 13.10.2023 | 62,5 | 96,0 | 19,9 |
| 12.10.2023 | 69,0 | 98,0 | 29,2 |
| 11.10.2023 | 72,9 | 99,5 | 27,5 |
| 10.10.2023 | 77,0 | 97,8 | 35,7 |
© Bayerisches Landesamt für Umwelt 2024