
- Startseite >
- Meteorologie >
- Relative Luftfeuchte >
- Isar >
- Ainertshofen >
- Jahresgrafik

Jahresgrafik Ainertshofen
Relative Luftfeuchte vom 22.09.2020 bis zum 21.09.2021
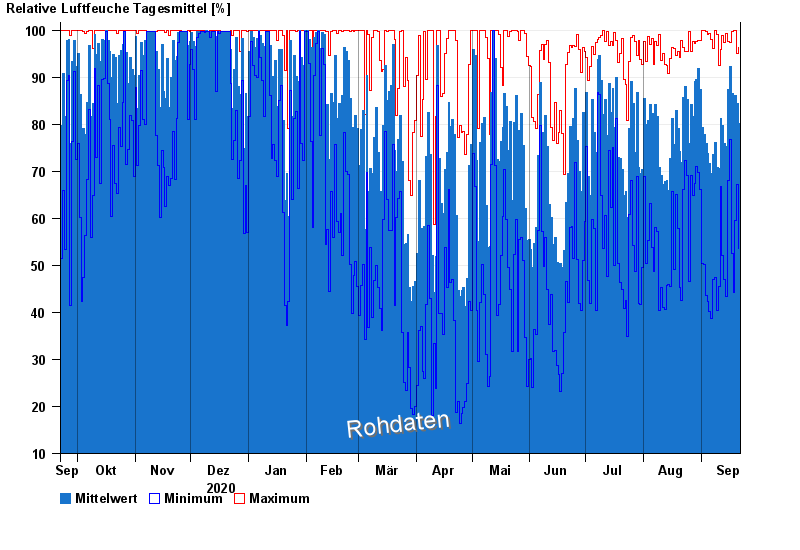
| Datum | Mittelwert [%] | Maximum [%] | Minimum [%] |
|---|---|---|---|
| 21.09.2021 | 80,2 | 96,3 | 53,5 |
| 20.09.2021 | 84,5 | 95,1 | 67,1 |
| 19.09.2021 | 86,2 | 99,9 | 59,5 |
| 18.09.2021 | 78,6 | 99,9 | 44,2 |
| 17.09.2021 | 86,6 | 99,8 | 52,5 |
| 16.09.2021 | 92,3 | 97,4 | 76,8 |
| 15.09.2021 | 87,3 | 97,6 | 68,1 |
© Bayerisches Landesamt für Umwelt 2024