
- Startseite >
- Meteorologie >
- Relative Luftfeuchte >
- Isar >
- Ainertshofen >
- Jahresgrafik

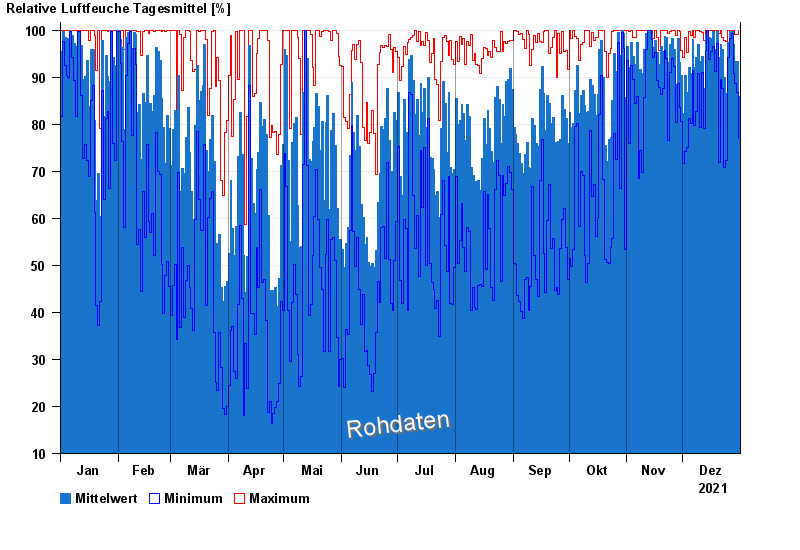
Jahresgrafik Ainertshofen
Relative Luftfeuchte vom 01.01.2021 bis zum 31.12.2021
| Datum | Mittelwert [%] | Maximum [%] | Minimum [%] |
|---|---|---|---|
| 31.12.2021 | 85,9 | 99,9 | 76,9 |
| 30.12.2021 | 93,4 | 99,0 | 86,8 |
| 29.12.2021 | 93,4 | 99,1 | 88,7 |
| 28.12.2021 | 96,9 | 99,9 | 90,8 |
| 27.12.2021 | 99,8 | 99,9 | 99,2 |
| 26.12.2021 | 99,7 | 99,9 | 98,3 |
| 25.12.2021 | 97,4 | 99,9 | 94,2 |
© Bayerisches Landesamt für Umwelt 2024