
- Startseite >
- Meteorologie >
- Relative Luftfeuchte >
- Inn >
- Rotthalmünster >
- Jahresgrafik

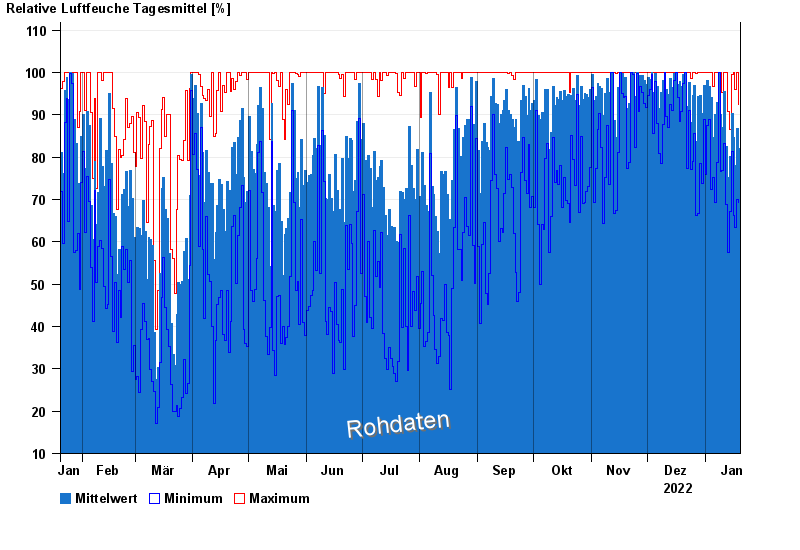
Jahresgrafik Rotthalmünster
Relative Luftfeuchte vom 20.01.2022 bis zum 19.01.2023
| Datum | Mittelwert [%] | Maximum [%] | Minimum [%] |
|---|---|---|---|
| 19.01.2023 | 82,0 | 92,5 | 69,4 |
| 18.01.2023 | 86,8 | 100,0 | 69,9 |
| 17.01.2023 | 78,1 | 96,0 | 63,4 |
| 16.01.2023 | 84,7 | 100,0 | 66,2 |
| 15.01.2023 | 90,4 | 99,5 | 81,3 |
| 14.01.2023 | 80,2 | 86,5 | 67,2 |
| 13.01.2023 | 75,3 | 90,9 | 57,5 |
© Bayerisches Landesamt für Umwelt 2024