
- Startseite >
- Meteorologie >
- Relative Luftfeuchte >
- Inn >
- Rotthalmünster >
- Jahresgrafik

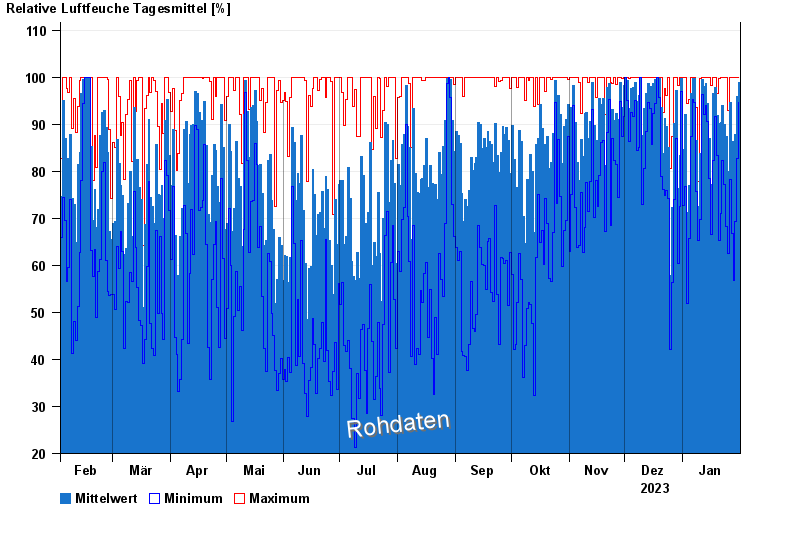
Jahresgrafik Rotthalmünster
Relative Luftfeuchte vom 01.02.2023 bis zum 31.01.2024
| Datum | Mittelwert [%] | Maximum [%] | Minimum [%] |
|---|---|---|---|
| 31.01.2024 | 98,9 | 100,0 | 94,6 |
| 30.01.2024 | 95,9 | 100,0 | 82,7 |
| 29.01.2024 | 87,9 | 100,0 | 69,4 |
| 28.01.2024 | 85,4 | 100,0 | 56,7 |
| 27.01.2024 | 86,4 | 100,0 | 66,7 |
| 26.01.2024 | 94,7 | 100,0 | 78,2 |
| 25.01.2024 | 79,9 | 93,0 | 62,5 |
© Bayerisches Landesamt für Umwelt 2024