
- Startseite >
- Meteorologie >
- Relative Luftfeuchte >
- Inn >
- Karolinenfeld >
- Jahresgrafik

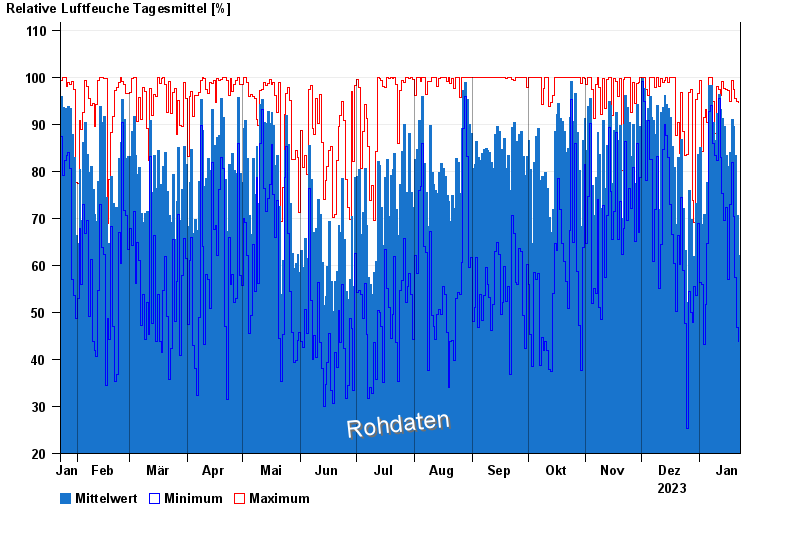
Jahresgrafik Karolinenfeld
Relative Luftfeuchte vom 23.01.2023 bis zum 22.01.2024
| Datum | Mittelwert [%] | Maximum [%] | Minimum [%] |
|---|---|---|---|
| 22.01.2024 | 62,1 | 94,6 | 43,8 |
| 21.01.2024 | 70,6 | 94,9 | 46,8 |
| 20.01.2024 | 83,4 | 95,4 | 57,5 |
| 19.01.2024 | 89,5 | 97,4 | 70,4 |
| 18.01.2024 | 91,0 | 99,3 | 81,9 |
| 17.01.2024 | 84,0 | 94,8 | 73,0 |
| 16.01.2024 | 81,1 | 97,2 | 57,1 |
© Bayerisches Landesamt für Umwelt 2024