
- Startseite >
- Meteorologie >
- Relative Luftfeuchte >
- Inn >
- Karolinenfeld >
- Jahresgrafik

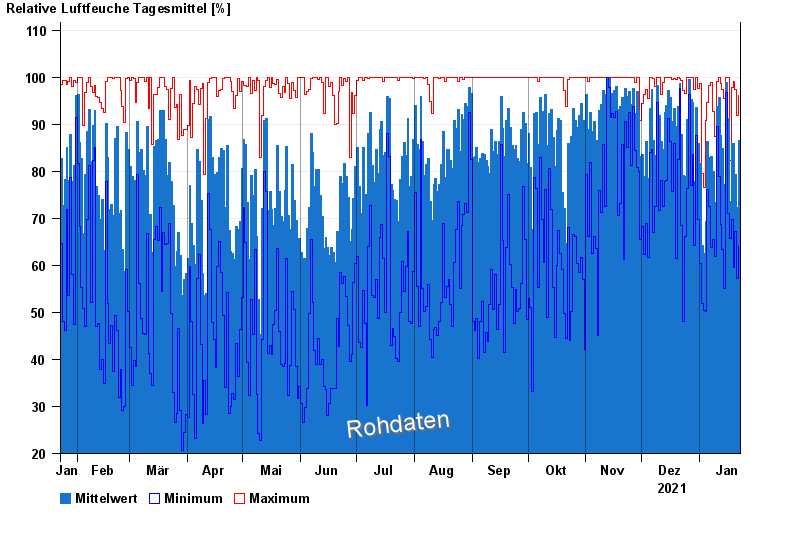
Jahresgrafik Karolinenfeld
Relative Luftfeuchte vom 23.01.2021 bis zum 22.01.2022
| Datum | Mittelwert [%] | Maximum [%] | Minimum [%] |
|---|---|---|---|
| 22.01.2022 | 86,5 | 96,1 | 64,1 |
| 21.01.2022 | 72,3 | 91,8 | 57,2 |
| 20.01.2022 | 79,4 | 97,3 | 67,1 |
| 19.01.2022 | 85,9 | 99,0 | 59,5 |
| 18.01.2022 | 86,0 | 97,8 | 69,7 |
| 17.01.2022 | 73,5 | 82,3 | 65,8 |
| 16.01.2022 | 91,3 | 99,9 | 71,0 |
© Bayerisches Landesamt für Umwelt 2024