
- Startseite >
- Meteorologie >
- Relative Luftfeuchte >
- Inn >
- Karolinenfeld >
- Jahresgrafik

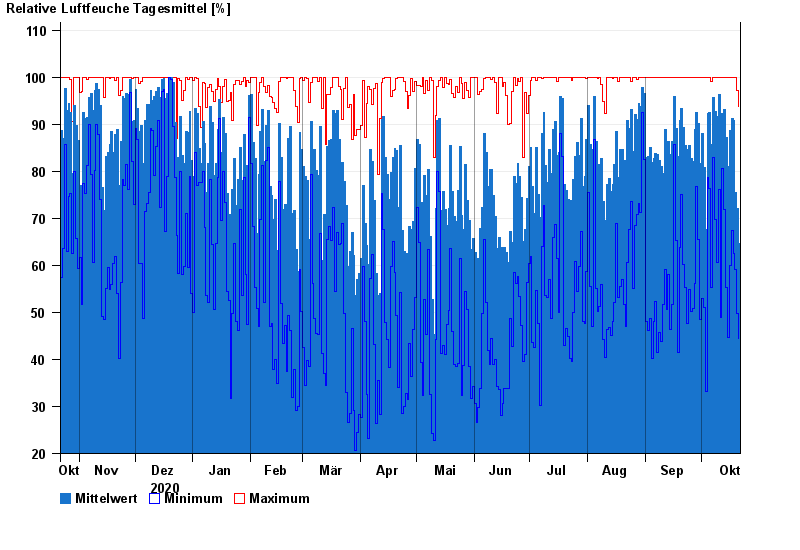
Jahresgrafik Karolinenfeld
Relative Luftfeuchte vom 22.10.2020 bis zum 21.10.2021
| Datum | Mittelwert [%] | Maximum [%] | Minimum [%] |
|---|---|---|---|
| 21.10.2021 | 64,6 | 93,8 | 44,4 |
| 20.10.2021 | 72,1 | 97,2 | 49,7 |
| 19.10.2021 | 75,4 | 99,9 | 59,1 |
| 18.10.2021 | 90,8 | 99,9 | 62,6 |
| 17.10.2021 | 91,3 | 99,9 | 67,4 |
| 16.10.2021 | 88,7 | 99,9 | 60,0 |
| 15.10.2021 | 81,1 | 99,9 | 44,6 |
© Bayerisches Landesamt für Umwelt 2024