
- Startseite >
- Meteorologie >
- Relative Luftfeuchte >
- Inn >
- Karolinenfeld >
- Jahresgrafik

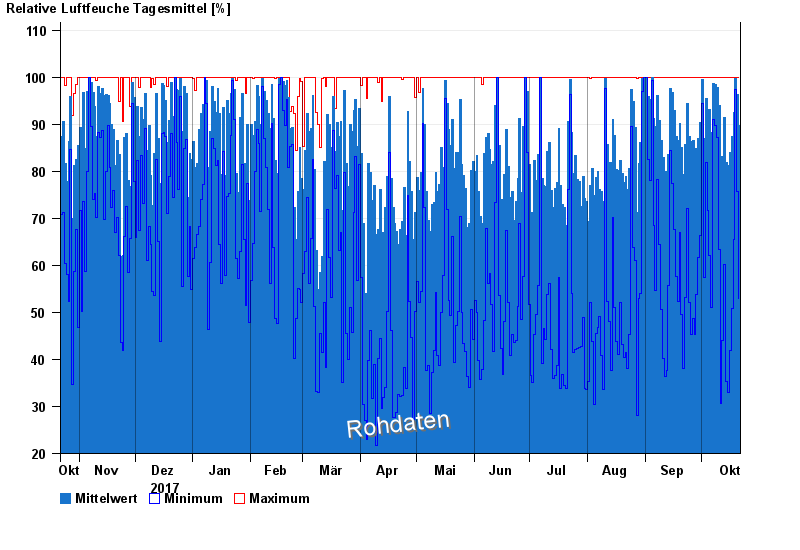
Jahresgrafik Karolinenfeld
Relative Luftfeuchte vom 22.10.2017 bis zum 21.10.2018
| Datum | Mittelwert [%] | Maximum [%] | Minimum [%] |
|---|---|---|---|
| 21.10.2018 | 89,7 | 100,0 | 53,0 |
| 20.10.2018 | 96,3 | 100,0 | 75,8 |
| 19.10.2018 | 99,8 | 100,0 | 97,4 |
| 18.10.2018 | 92,4 | 100,0 | 65,4 |
| 17.10.2018 | 87,4 | 100,0 | 50,8 |
| 16.10.2018 | 84,0 | 100,0 | 41,8 |
| 15.10.2018 | 81,3 | 100,0 | 33,0 |
© Bayerisches Landesamt für Umwelt 2024