
- Startseite >
- Meteorologie >
- Relative Luftfeuchte >
- Inn >
- Karolinenfeld >
- Jahresgrafik

Jahresgrafik Karolinenfeld
Relative Luftfeuchte vom 01.01.2019 bis zum 31.12.2019
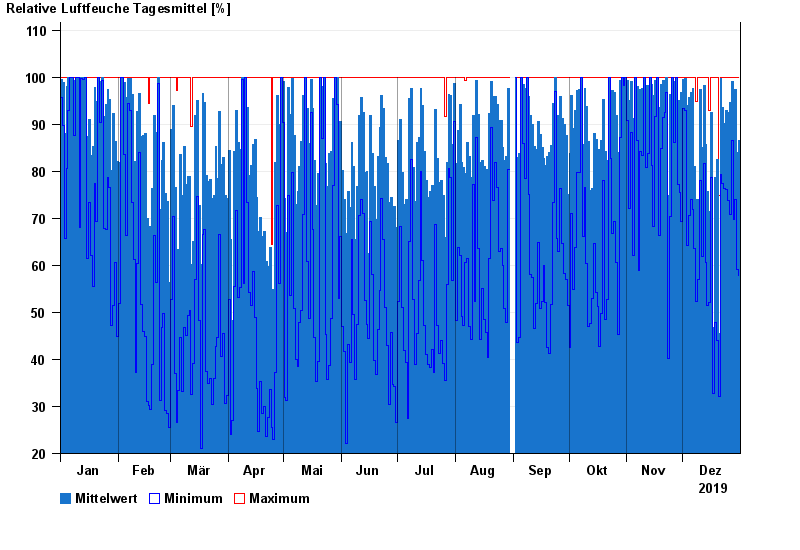
Hinweis: Die Zeitreihe im gewählten Zeitraum weist Lücken auf.
| Datum | Mittelwert [%] | Maximum [%] | Minimum [%] |
|---|---|---|---|
| 31.12.2019 | 86,6 | 100,0 | 57,9 |
| 30.12.2019 | 83,9 | 100,0 | 59,1 |
| 29.12.2019 | 97,3 | 100,0 | 74,1 |
| 28.12.2019 | 97,3 | 100,0 | 69,7 |
| 27.12.2019 | 99,0 | 100,0 | 86,6 |
| 26.12.2019 | 94,7 | 100,0 | 70,9 |
| 25.12.2019 | 92,4 | 100,0 | 73,7 |
© Bayerisches Landesamt für Umwelt 2024