
- Startseite >
- Meteorologie >
- Relative Luftfeuchte >
- Inn >
- Albertshofen >
- Jahresgrafik

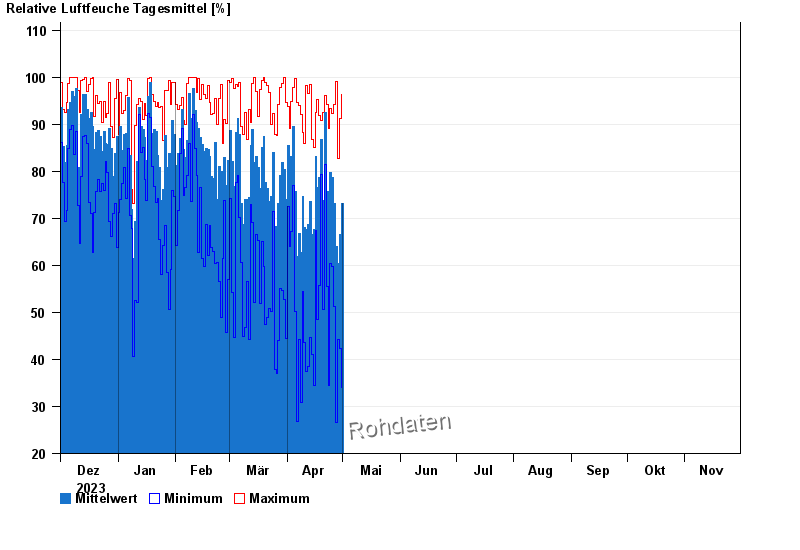
Jahresgrafik Albertshofen
Relative Luftfeuchte vom 01.12.2023 bis zum 30.11.2024
| Datum | Mittelwert [%] | Maximum [%] | Minimum [%] |
|---|---|---|---|
| 09.11.2024 | 89,6 | 89,9 | 89,3 |
| 08.11.2024 | 91,8 | 99,0 | 87,2 |
| 07.11.2024 | 86,7 | 91,5 | 79,8 |
| 06.11.2024 | 94,7 | 100,0 | 87,9 |
| 05.11.2024 | 97,8 | 100,0 | 92,7 |
| 04.11.2024 | 99,9 | 100,0 | 99,2 |
| 03.11.2024 | 86,6 | 98,8 | 60,6 |
© Bayerisches Landesamt für Umwelt 2024