
- Startseite >
- Meteorologie >
- Relative Luftfeuchte >
- Inn >
- Albertshofen >
- Jahresgrafik

Jahresgrafik Albertshofen
Relative Luftfeuchte vom 01.01.2020 bis zum 31.12.2020
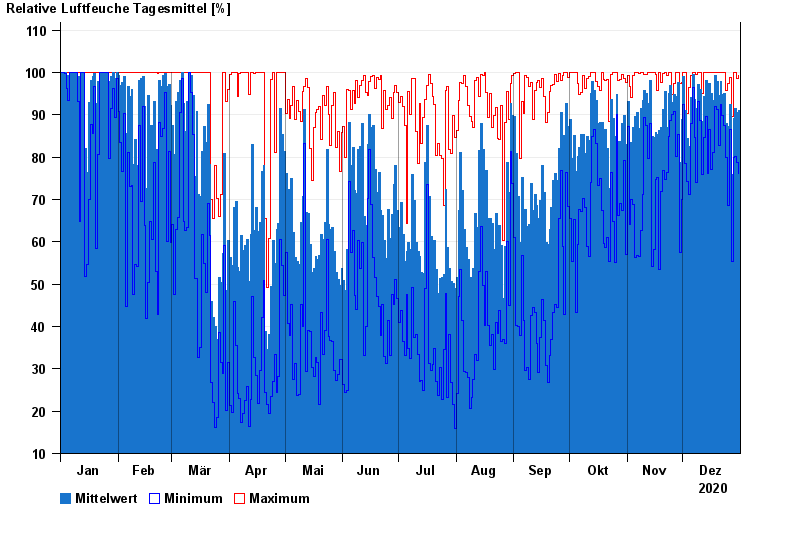
| Datum | Mittelwert [%] | Maximum [%] | Minimum [%] |
|---|---|---|---|
| 31.12.2020 | 91,0 | 99,2 | 76,2 |
| 30.12.2020 | 90,6 | 98,6 | 78,8 |
| 29.12.2020 | 91,4 | 100,0 | 80,1 |
| 28.12.2020 | 89,2 | 99,9 | 79,9 |
| 27.12.2020 | 76,0 | 89,7 | 55,3 |
| 26.12.2020 | 92,5 | 98,8 | 86,5 |
| 25.12.2020 | 87,3 | 97,4 | 68,6 |
© Bayerisches Landesamt für Umwelt 2024