
- Startseite >
- Meteorologie >
- Relative Luftfeuchte >
- Oberer Main - Elbe >
- Staffelstein Bad >
- Jahresgrafik

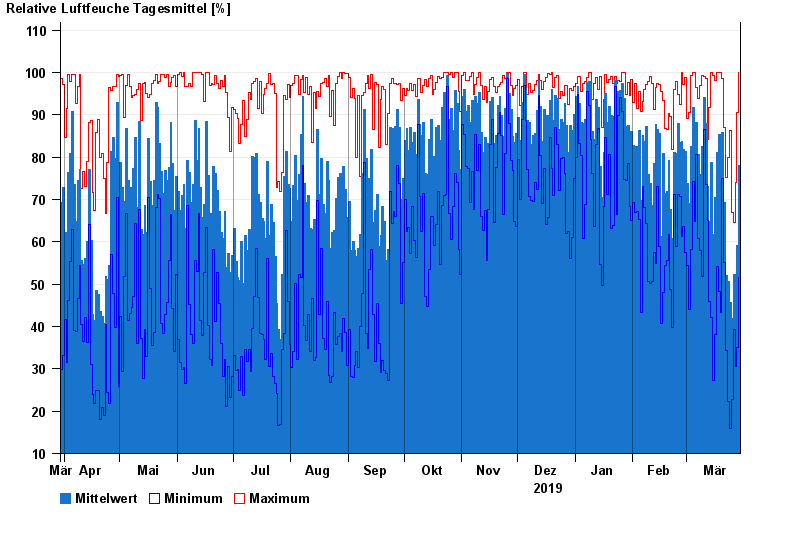
Jahresgrafik Staffelstein Bad
Relative Luftfeuchte vom 30.03.2019 bis zum 29.03.2020
| Datum | Mittelwert [%] | Maximum [%] | Minimum [%] |
|---|---|---|---|
| 29.03.2020 | 78,1 | 99,9 | 51,6 |
| 28.03.2020 | 59,1 | 90,6 | 35,0 |
| 27.03.2020 | 49,8 | 74,0 | 30,6 |
| 26.03.2020 | 52,3 | 64,6 | 39,2 |
| 25.03.2020 | 42,0 | 67,0 | 22,7 |
| 24.03.2020 | 45,6 | 86,4 | 16,0 |
| 23.03.2020 | 50,6 | 80,0 | 22,2 |
© Bayerisches Landesamt für Umwelt 2024