
- Startseite >
- Meteorologie >
- Relative Luftfeuchte >
- Oberer Main - Elbe >
- Schneibsteinhaus >
- Jahresgrafik

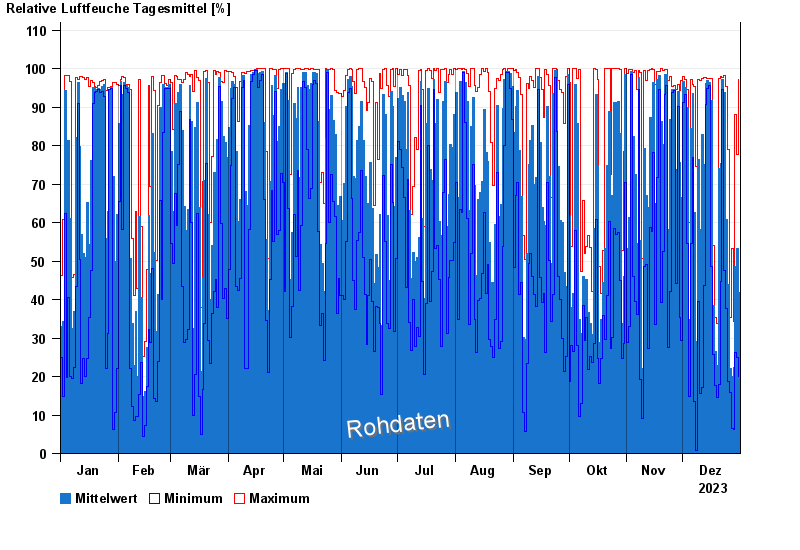
Jahresgrafik Schneibsteinhaus
Relative Luftfeuchte vom 01.01.2023 bis zum 31.12.2023
| Datum | Mittelwert [%] | Maximum [%] | Minimum [%] |
|---|---|---|---|
| 31.12.2023 | 41,9 | 97,1 | 19,9 |
| 30.12.2023 | 53,3 | 77,8 | 24,9 |
| 29.12.2023 | 48,7 | 88,0 | 26,3 |
| 28.12.2023 | 22,4 | 34,3 | 6,3 |
| 27.12.2023 | 20,1 | 53,4 | 6,5 |
| 26.12.2023 | 22,0 | 35,3 | 15,9 |
| 25.12.2023 | 44,0 | 78,9 | 18,6 |
© Bayerisches Landesamt für Umwelt 2025