
- Startseite >
- Meteorologie >
- Relative Luftfeuchte >
- Oberer Main - Elbe >
- Mauthaus (Klimastation) >
- Jahresgrafik

Jahresgrafik Mauthaus (Klimastation)
Relative Luftfeuchte vom 03.12.2022 bis zum 02.12.2023
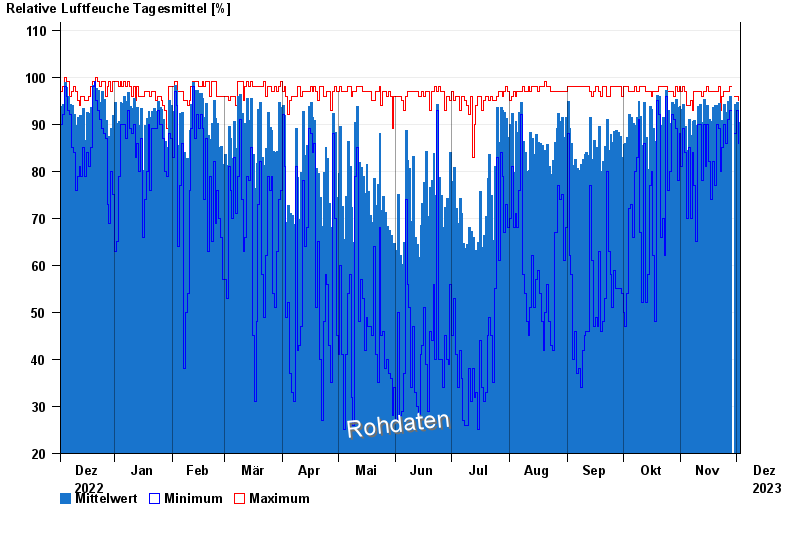
Hinweis: Die Zeitreihe im gewählten Zeitraum weist Lücken auf.
| Datum | Mittelwert [%] | Maximum [%] | Minimum [%] |
|---|---|---|---|
| 02.12.2023 | 90,3 | 95,0 | 86,0 |
| 01.12.2023 | 94,6 | 96,0 | 93,0 |
| 30.11.2023 | 94,2 | 96,0 | 88,0 |
| 27.11.2023 | 96,0 | 98,0 | 93,0 |
| 26.11.2023 | 94,9 | 97,0 | 91,0 |
| 25.11.2023 | 92,5 | 97,0 | 86,0 |
| 24.11.2023 | 94,1 | 97,0 | 90,0 |
© Bayerisches Landesamt für Umwelt 2024