
- Startseite >
- Meteorologie >
- Relative Luftfeuchte >
- Oberer Main - Elbe >
- Mauthaus (Klimastation) >
- Jahresgrafik

Jahresgrafik Mauthaus (Klimastation)
Relative Luftfeuchte vom 01.01.2020 bis zum 31.12.2020
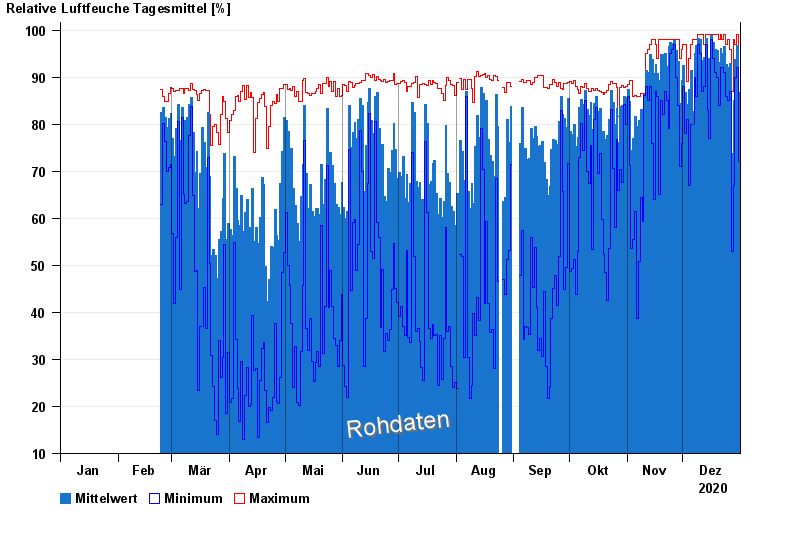
Hinweis: Die Zeitreihe im gewählten Zeitraum weist Lücken auf.
| Datum | Mittelwert [%] | Maximum [%] | Minimum [%] |
|---|---|---|---|
| 31.12.2020 | 86,8 | 95,0 | 72,0 |
| 30.12.2020 | 96,7 | 99,0 | 92,0 |
| 29.12.2020 | 93,8 | 97,0 | 90,0 |
| 28.12.2020 | 85,0 | 98,0 | 67,0 |
| 27.12.2020 | 73,7 | 87,0 | 53,0 |
| 26.12.2020 | 92,9 | 96,0 | 87,0 |
| 25.12.2020 | 92,0 | 98,0 | 85,0 |
© Bayerisches Landesamt für Umwelt 2024