
- Startseite >
- Meteorologie >
- Relative Luftfeuchte >
- Oberer Main - Elbe >
- Kemnath >
- Jahresgrafik

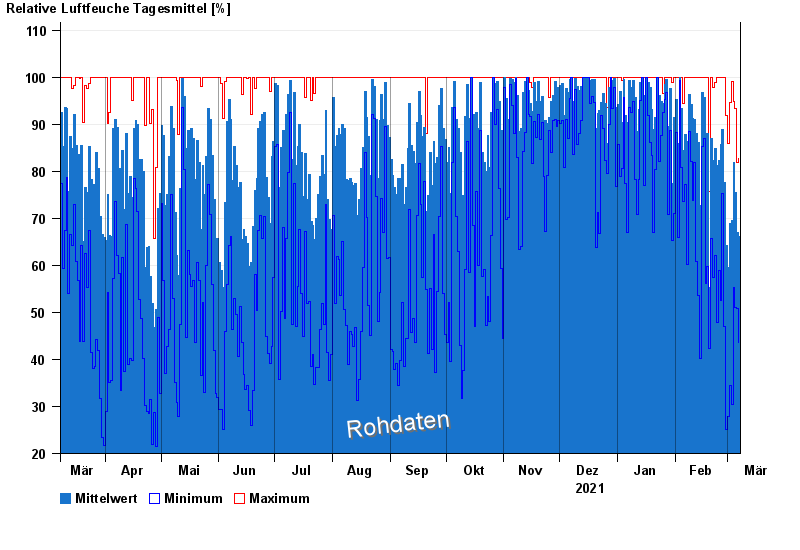
Jahresgrafik Kemnath
Relative Luftfeuchte vom 08.03.2021 bis zum 07.03.2022
| Datum | Mittelwert [%] | Maximum [%] | Minimum [%] |
|---|---|---|---|
| 07.03.2022 | 66,2 | 82,8 | 43,7 |
| 06.03.2022 | 67,0 | 81,9 | 50,9 |
| 05.03.2022 | 75,4 | 93,3 | 51,1 |
| 04.03.2022 | 81,8 | 94,9 | 55,3 |
| 03.03.2022 | 69,6 | 99,1 | 30,5 |
| 02.03.2022 | 68,9 | 94,6 | 34,4 |
| 01.03.2022 | 59,6 | 85,9 | 27,9 |
© Bayerisches Landesamt für Umwelt 2024