
- Startseite >
- Meteorologie >
- Relative Luftfeuchte >
- Oberer Main - Elbe >
- Hiltpoltstein >
- Jahresgrafik

Jahresgrafik Hiltpoltstein
Relative Luftfeuchte vom 01.01.2020 bis zum 31.12.2020
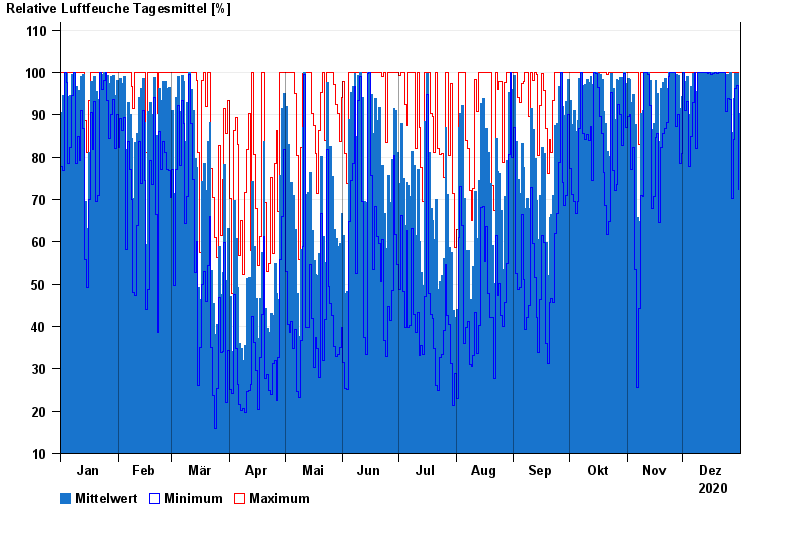
| Datum | Mittelwert [%] | Maximum [%] | Minimum [%] |
|---|---|---|---|
| 31.12.2020 | 90,3 | 100,0 | 72,4 |
| 30.12.2020 | 99,8 | 100,0 | 96,9 |
| 29.12.2020 | 99,8 | 100,0 | 96,3 |
| 28.12.2020 | 93,8 | 100,0 | 84,2 |
| 27.12.2020 | 85,8 | 100,0 | 70,3 |
| 26.12.2020 | 99,9 | 100,0 | 93,7 |
| 25.12.2020 | 99,5 | 100,0 | 93,9 |
© Bayerisches Landesamt für Umwelt 2024