
- Startseite >
- Meteorologie >
- Relative Luftfeuchte >
- Oberer Main - Elbe >
- Förmitztalsperre >
- Jahresgrafik

Jahresgrafik Förmitztalsperre
Relative Luftfeuchte vom 27.09.2020 bis zum 26.09.2021
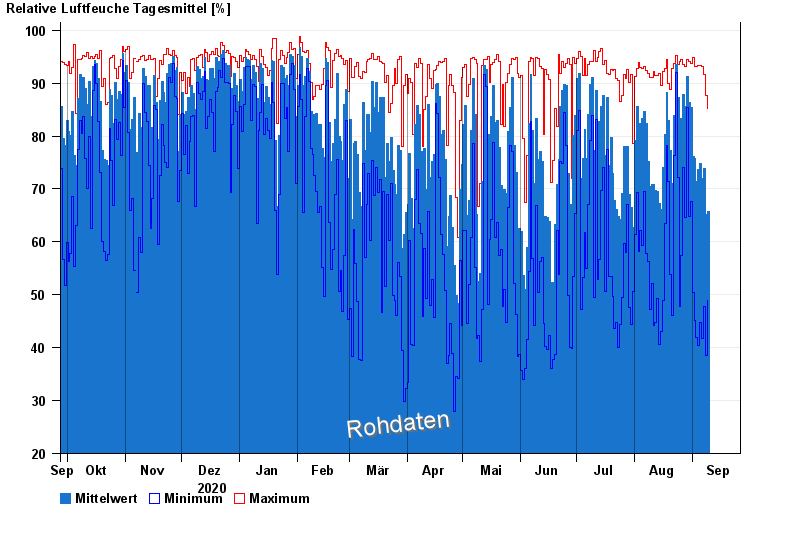
Hinweis: Die Zeitreihe im gewählten Zeitraum weist Lücken auf.
| Datum | Mittelwert [%] | Maximum [%] | Minimum [%] |
|---|---|---|---|
| 09.09.2021 | 65,8 | 85,2 | 48,9 |
| 08.09.2021 | 65,2 | 87,6 | 38,6 |
| 07.09.2021 | 73,8 | 91,7 | 47,7 |
| 06.09.2021 | 72,0 | 93,2 | 41,7 |
| 05.09.2021 | 74,8 | 93,3 | 44,7 |
| 04.09.2021 | 73,7 | 93,3 | 40,4 |
| 03.09.2021 | 71,4 | 93,1 | 41,9 |
© Bayerisches Landesamt für Umwelt 2024