
- Startseite >
- Meteorologie >
- Relative Luftfeuchte >
- Bayern >
- Würzburg-Stein >
- Jahresgrafik

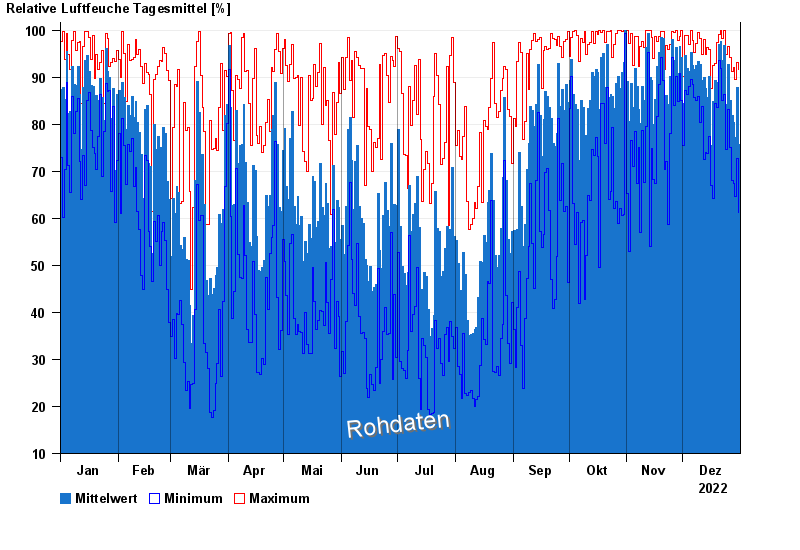
Jahresgrafik Würzburg-Stein
Relative Luftfeuchte vom 01.01.2022 bis zum 31.12.2022
| Datum | Mittelwert [%] | Maximum [%] | Minimum [%] |
|---|---|---|---|
| 31.12.2022 | 75,8 | 91,7 | 61,3 |
| 30.12.2022 | 87,9 | 93,1 | 72,8 |
| 29.12.2022 | 77,1 | 89,6 | 64,7 |
| 28.12.2022 | 80,3 | 92,1 | 67,4 |
| 27.12.2022 | 81,8 | 91,3 | 68,1 |
| 26.12.2022 | 85,0 | 94,2 | 75,1 |
| 25.12.2022 | 92,7 | 96,5 | 83,1 |
© Bayerisches Landesamt für Umwelt 2024