
- Startseite >
- Meteorologie >
- Relative Luftfeuchte >
- Bayern >
- Wartsteinkopf >
- Jahresgrafik

Jahresgrafik Wartsteinkopf
Relative Luftfeuchte vom 20.04.2024 bis zum 19.04.2025
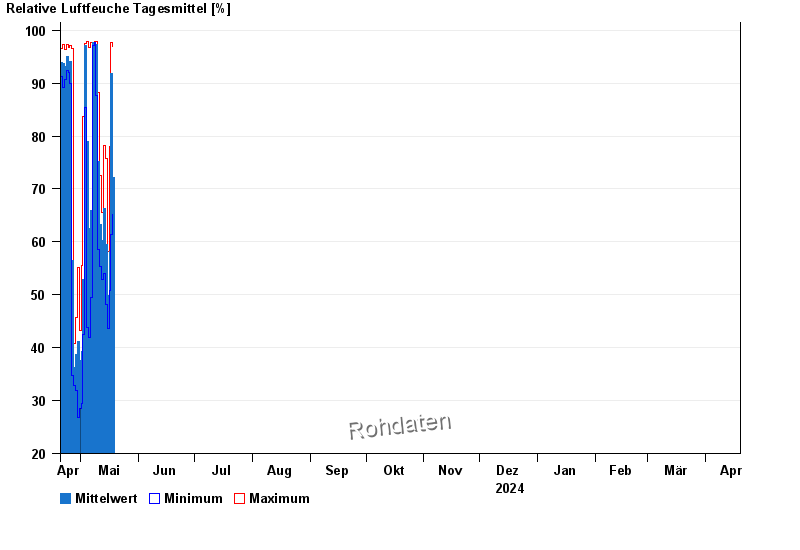
| Datum | Mittelwert [%] | Maximum [%] | Minimum [%] |
|---|---|---|---|
| 02.05.2024 | 54,2 | 60,1 | 49,3 |
| 01.05.2024 | 39,2 | 55,6 | 29,4 |
| 30.04.2024 | 37,5 | 43,3 | 28,5 |
| 29.04.2024 | 41,1 | 55,1 | 26,8 |
| 28.04.2024 | 38,7 | 45,7 | 31,9 |
| 27.04.2024 | 36,3 | 40,8 | 32,8 |
| 26.04.2024 | 56,5 | 96,5 | 34,7 |
© Bayerisches Landesamt für Umwelt 2024