
- Startseite >
- Meteorologie >
- Relative Luftfeuchte >
- Bayern >
- Sandharlanden >
- Jahresgrafik

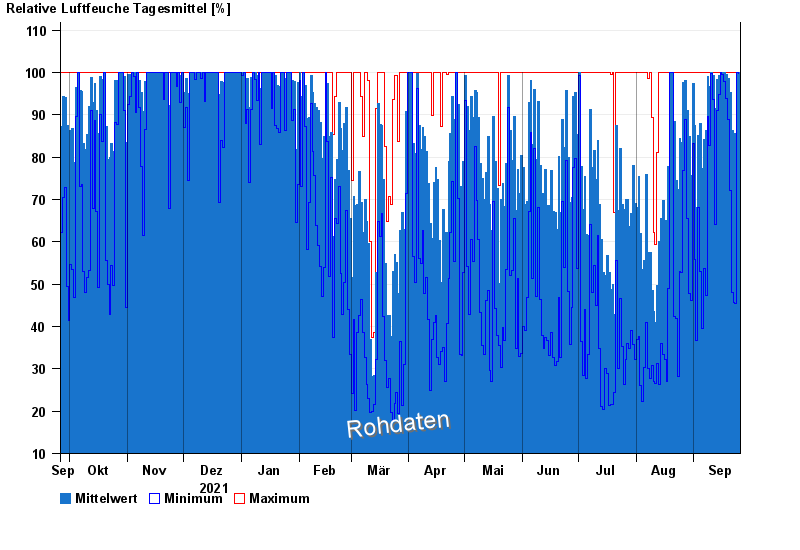
Jahresgrafik Sandharlanden
Relative Luftfeuchte vom 26.09.2021 bis zum 25.09.2022
| Datum | Mittelwert [%] | Maximum [%] | Minimum [%] |
|---|---|---|---|
| 25.09.2022 | 100,0 | 100,0 | 99,7 |
| 24.09.2022 | 100,0 | 100,0 | 100,0 |
| 23.09.2022 | 85,6 | 100,0 | 45,5 |
| 22.09.2022 | 84,7 | 100,0 | 45,7 |
| 21.09.2022 | 86,4 | 100,0 | 48,0 |
| 20.09.2022 | 95,2 | 100,0 | 72,1 |
| 19.09.2022 | 98,6 | 100,0 | 88,8 |
© Bayerisches Landesamt für Umwelt 2024