
- Startseite >
- Meteorologie >
- Relative Luftfeuchte >
- Bayern >
- Ruhstorf a. d. Rott >
- Jahresgrafik

Jahresgrafik Ruhstorf a. d. Rott
Relative Luftfeuchte vom 01.01.2023 bis zum 31.12.2023
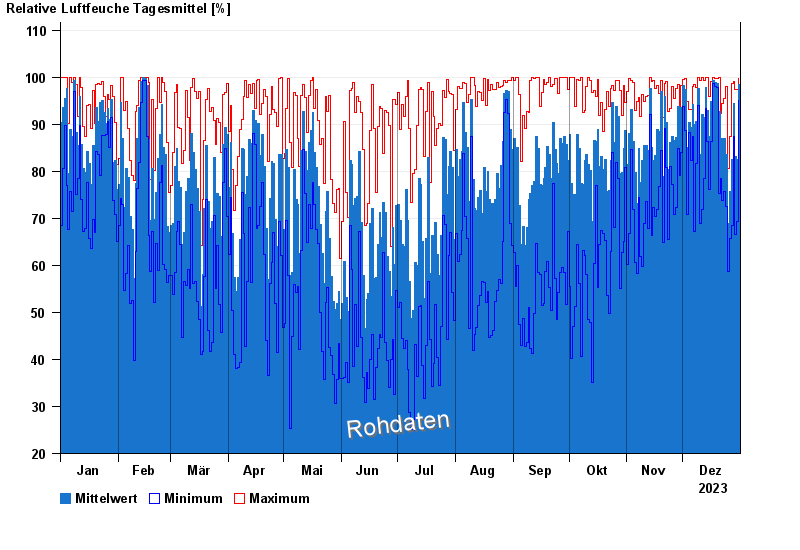
| Datum | Mittelwert [%] | Maximum [%] | Minimum [%] |
|---|---|---|---|
| 31.12.2023 | 98,4 | 99,8 | 95,0 |
| 30.12.2023 | 82,5 | 97,3 | 69,3 |
| 29.12.2023 | 83,2 | 97,3 | 66,5 |
| 28.12.2023 | 94,5 | 99,1 | 87,4 |
| 27.12.2023 | 82,5 | 98,7 | 68,4 |
| 26.12.2023 | 75,7 | 87,3 | 65,8 |
| 25.12.2023 | 68,9 | 80,6 | 58,7 |
© Bayerisches Landesamt für Umwelt 2025