
- Startseite >
- Meteorologie >
- Relative Luftfeuchte >
- Bayern >
- Obersteinbach >
- Jahresgrafik

Jahresgrafik Obersteinbach
Relative Luftfeuchte vom 01.01.2023 bis zum 31.12.2023
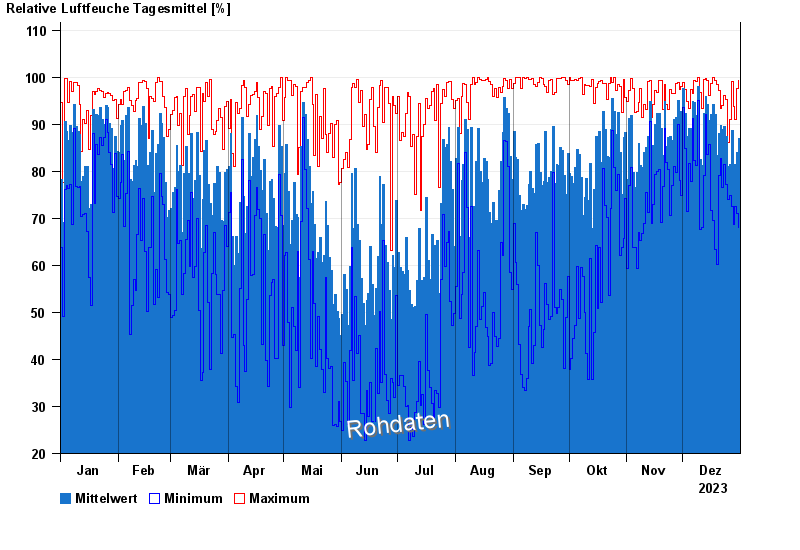
| Datum | Mittelwert [%] | Maximum [%] | Minimum [%] |
|---|---|---|---|
| 31.12.2023 | 86,9 | 99,3 | 68,0 |
| 30.12.2023 | 83,9 | 97,7 | 71,0 |
| 29.12.2023 | 81,4 | 91,1 | 72,6 |
| 28.12.2023 | 79,2 | 93,8 | 68,6 |
| 27.12.2023 | 88,7 | 99,1 | 72,5 |
| 26.12.2023 | 81,4 | 91,1 | 74,9 |
| 25.12.2023 | 81,0 | 86,2 | 74,1 |
© Bayerisches Landesamt für Umwelt 2025