
- Startseite >
- Meteorologie >
- Relative Luftfeuchte >
- Bayern >
- Hofheim i. Ufr. >
- Jahresgrafik

Jahresgrafik Hofheim i. Ufr.
Relative Luftfeuchte vom 04.10.2022 bis zum 03.10.2023
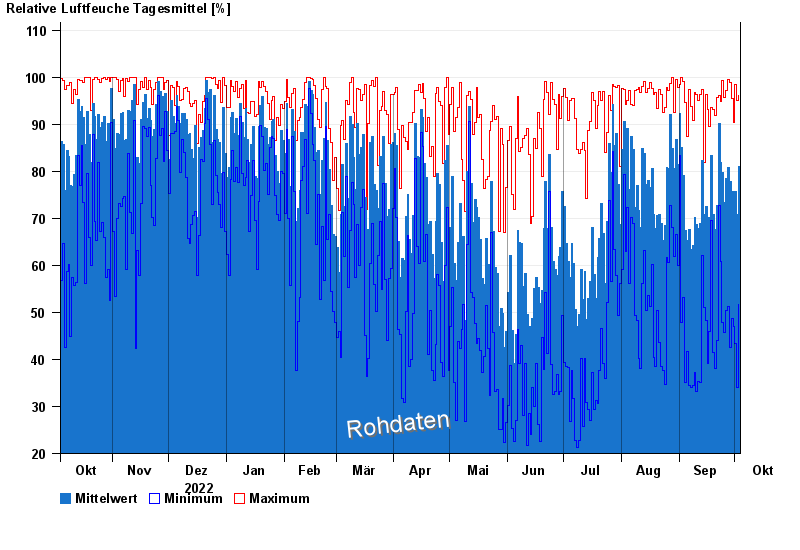
| Datum | Mittelwert [%] | Maximum [%] | Minimum [%] |
|---|---|---|---|
| 03.10.2023 | 81,0 | 96,1 | 51,7 |
| 02.10.2023 | 70,9 | 95,1 | 34,0 |
| 01.10.2023 | 75,6 | 98,5 | 43,3 |
| 30.09.2023 | 72,1 | 90,3 | 47,0 |
| 29.09.2023 | 75,8 | 95,5 | 48,6 |
| 28.09.2023 | 77,9 | 98,9 | 42,5 |
| 27.09.2023 | 80,9 | 99,6 | 51,3 |
© Bayerisches Landesamt für Umwelt 2024