
- Startseite >
- Meteorologie >
- Relative Luftfeuchte >
- Bayern >
- Gaibach-Kapellenberg >
- Jahresgrafik

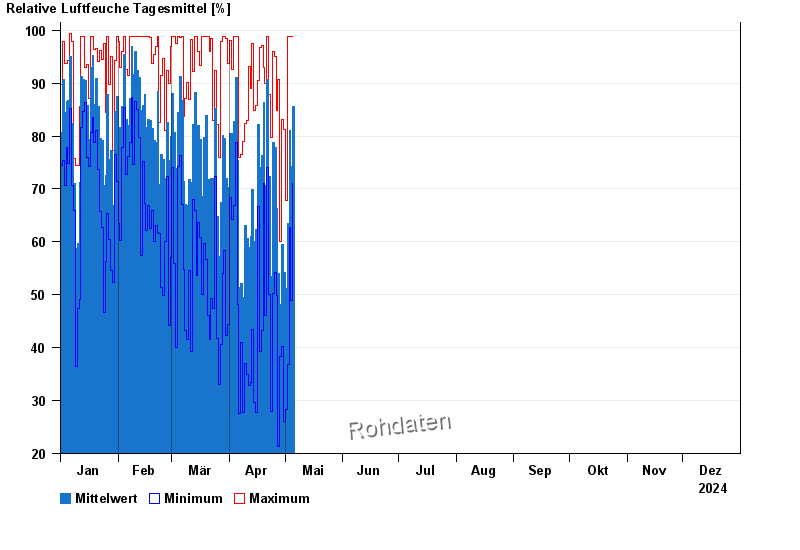
Jahresgrafik Gaibach-Kapellenberg
Relative Luftfeuchte vom 01.01.2024 bis zum 31.12.2024
| Datum | Mittelwert [%] | Maximum [%] | Minimum [%] |
|---|---|---|---|
| 31.05.2024 | 85,5 | 95,7 | 70,1 |
| 30.05.2024 | 89,9 | 98,8 | 69,9 |
| 29.05.2024 | 72,9 | 89,7 | 64,6 |
| 28.05.2024 | 66,4 | 95,4 | 39,4 |
| 27.05.2024 | 79,2 | 98,5 | 51,1 |
| 26.05.2024 | 67,7 | 98,8 | 40,0 |
| 25.05.2024 | 80,3 | 98,8 | 50,5 |
© Bayerisches Landesamt für Umwelt 2024