
- Startseite >
- Meteorologie >
- Luftdruck >
- Isar >
- Rauschberg 2 >
- Jahresgrafik

Jahresgrafik Rauschberg 2
Luftdruck vom 27.02.2021 bis zum 26.02.2022
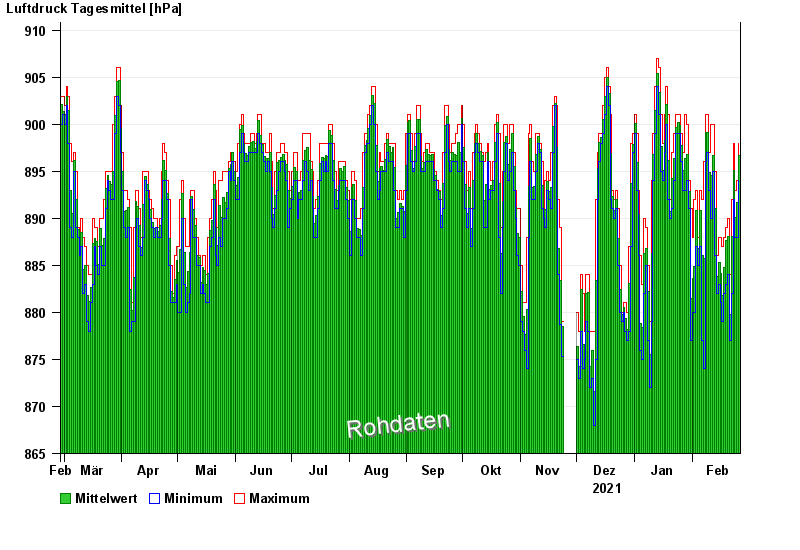
Hinweis: Die Zeitreihe im gewählten Zeitraum weist Lücken auf.
| Datum | Mittelwert [hPa] | Maximum [hPa] | Minimum [hPa] |
|---|---|---|---|
| 26.02.2022 | 896,7 | 898,0 | 894,0 |
| 25.02.2022 | 891,7 | 894,0 | 888,0 |
| 24.02.2022 | 890,1 | 893,0 | 888,0 |
| 23.02.2022 | 895,1 | 898,0 | 892,0 |
| 22.02.2022 | 888,1 | 892,0 | 882,0 |
| 21.02.2022 | 879,8 | 884,0 | 877,0 |
| 20.02.2022 | 888,1 | 890,0 | 884,0 |
© Bayerisches Landesamt für Umwelt 2024