
- Startseite >
- Meteorologie >
- Luftdruck >
- Isar >
- Rauschberg 2 >
- Jahresgrafik

Jahresgrafik Rauschberg 2
Luftdruck vom 19.08.2019 bis zum 18.08.2020
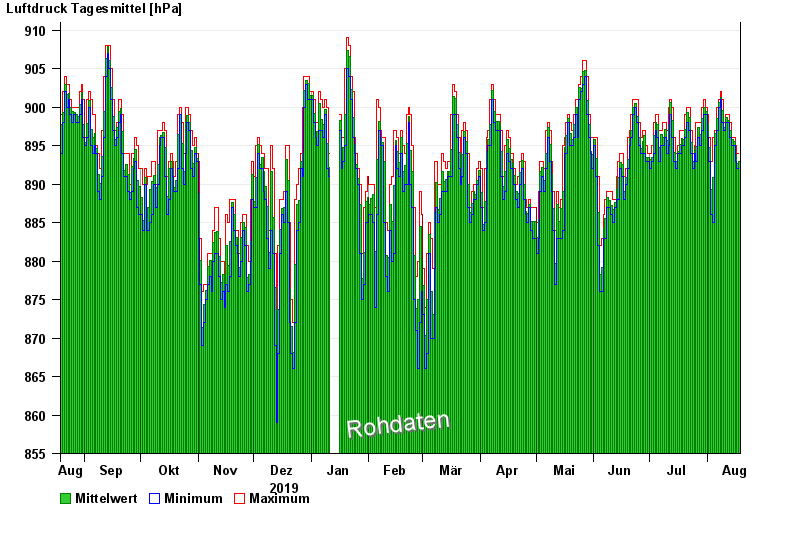
Hinweis: Die Zeitreihe im gewählten Zeitraum weist Lücken auf.
| Datum | Mittelwert [hPa] | Maximum [hPa] | Minimum [hPa] |
|---|---|---|---|
| 18.08.2020 | 892,9 | 894,0 | 892,0 |
| 17.08.2020 | 892,7 | 894,0 | 892,0 |
| 16.08.2020 | 893,8 | 895,0 | 893,0 |
| 15.08.2020 | 895,6 | 896,0 | 895,0 |
| 14.08.2020 | 895,8 | 896,0 | 895,0 |
| 13.08.2020 | 897,0 | 898,0 | 896,0 |
| 12.08.2020 | 898,3 | 899,0 | 898,0 |
© Bayerisches Landesamt für Umwelt 2024