
- Startseite >
- Meteorologie >
- Luftdruck >
- Isar >
- Rauschberg 2 >
- Jahresgrafik

Jahresgrafik Rauschberg 2
Luftdruck vom 07.07.2021 bis zum 06.07.2022
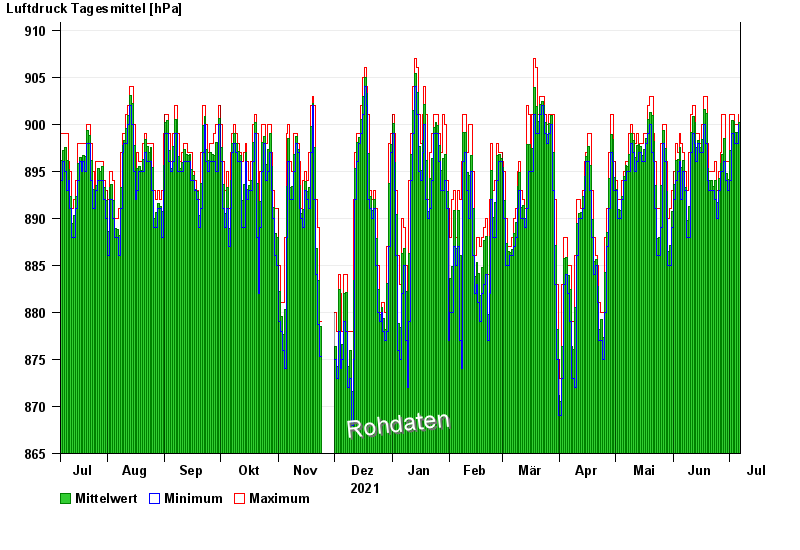
Hinweis: Die Zeitreihe im gewählten Zeitraum weist Lücken auf.
| Datum | Mittelwert [hPa] | Maximum [hPa] | Minimum [hPa] |
|---|---|---|---|
| 06.07.2022 | 900,2 | 901,0 | 900,0 |
| 05.07.2022 | 899,1 | 900,0 | 898,0 |
| 04.07.2022 | 899,1 | 900,0 | 898,0 |
| 03.07.2022 | 900,3 | 901,0 | 899,0 |
| 02.07.2022 | 900,4 | 901,0 | 899,0 |
| 01.07.2022 | 897,2 | 901,0 | 894,0 |
| 30.06.2022 | 894,1 | 896,0 | 893,0 |
© Bayerisches Landesamt für Umwelt 2024