
- Startseite >
- Meteorologie >
- Luftdruck >
- Isar >
- Rauschberg 2 >
- Jahresgrafik

Jahresgrafik Rauschberg 2
Luftdruck vom 05.12.2019 bis zum 04.12.2020
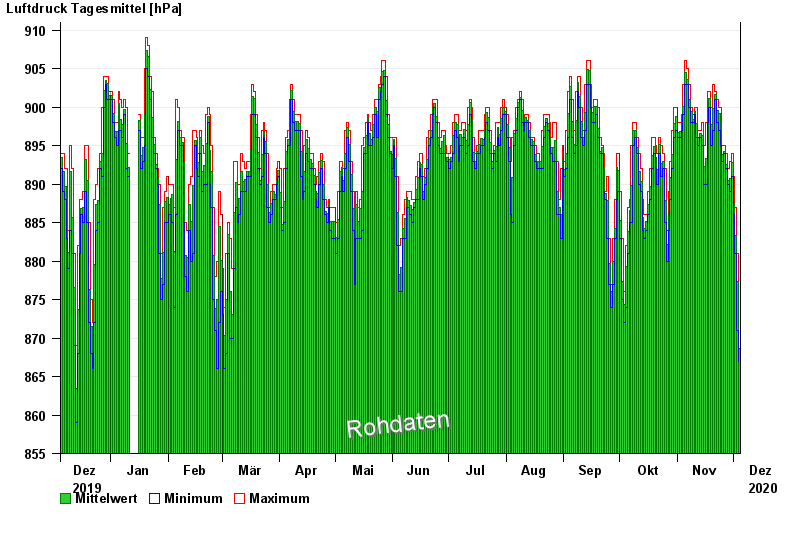
Hinweis: Die Zeitreihe im gewählten Zeitraum weist Lücken auf.
| Datum | Mittelwert [hPa] | Maximum [hPa] | Minimum [hPa] |
|---|---|---|---|
| 04.12.2020 | 868,7 | 871,0 | 867,0 |
| 03.12.2020 | 877,4 | 881,0 | 871,0 |
| 02.12.2020 | 883,3 | 887,0 | 881,0 |
| 01.12.2020 | 887,4 | 891,0 | 886,0 |
| 30.11.2020 | 892,8 | 894,0 | 891,0 |
| 29.11.2020 | 890,7 | 893,0 | 889,0 |
| 28.11.2020 | 890,5 | 892,0 | 890,0 |
© Bayerisches Landesamt für Umwelt 2024