
- Startseite >
- Meteorologie >
- Luftdruck >
- Isar >
- Geretsried (Klima) >
- Jahresgrafik

Jahresgrafik Geretsried (Klima)
Luftdruck vom 22.10.2021 bis zum 21.10.2022
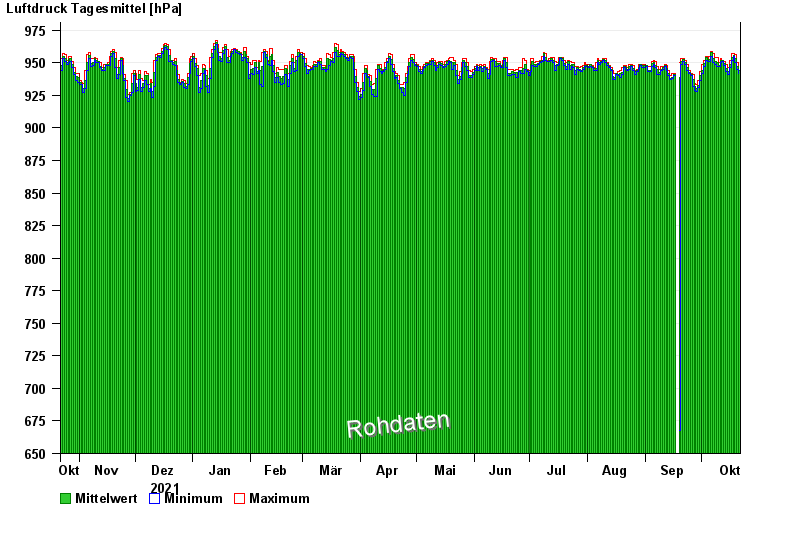
Hinweis: Die Zeitreihe im gewählten Zeitraum weist Lücken auf.
| Datum | Mittelwert [hPa] | Maximum [hPa] | Minimum [hPa] |
|---|---|---|---|
| 21.10.2022 | 944,2 | 947,0 | 942,0 |
| 20.10.2022 | 947,2 | 950,0 | 945,0 |
| 19.10.2022 | 953,1 | 956,0 | 950,0 |
| 18.10.2022 | 955,8 | 957,0 | 955,0 |
| 17.10.2022 | 954,3 | 957,0 | 952,0 |
| 16.10.2022 | 948,9 | 952,0 | 946,0 |
| 15.10.2022 | 943,2 | 946,0 | 941,0 |
© Bayerisches Landesamt für Umwelt 2024