
- Startseite >
- Meteorologie >
- Luftdruck >
- Iller - Lech - Bodensee >
- Trauchgau >
- Jahresgrafik

Jahresgrafik Trauchgau
Luftdruck vom 08.07.2020 bis zum 07.07.2021
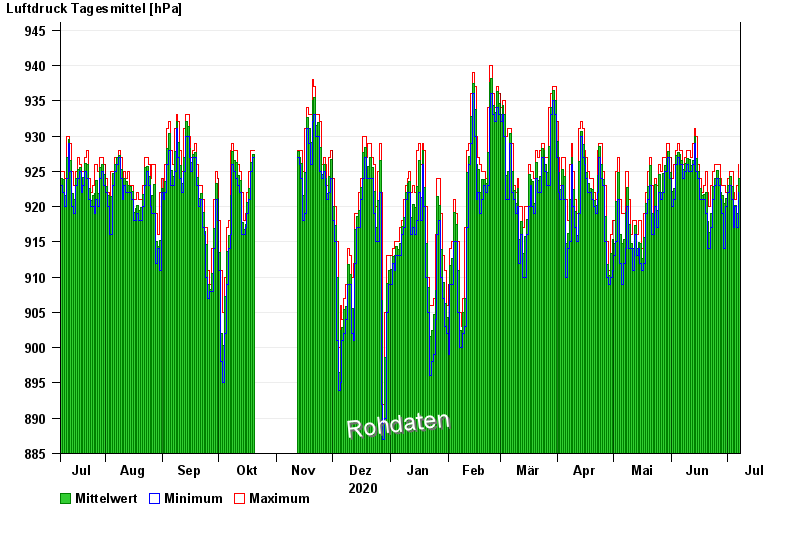
Hinweis: Die Zeitreihe im gewählten Zeitraum weist Lücken auf.
| Datum | Mittelwert [hPa] | Maximum [hPa] | Minimum [hPa] |
|---|---|---|---|
| 07.07.2021 | 924,0 | 926,0 | 922,0 |
| 06.07.2021 | 919,0 | 923,0 | 917,0 |
| 05.07.2021 | 920,2 | 921,0 | 920,0 |
| 04.07.2021 | 919,8 | 922,0 | 917,0 |
| 03.07.2021 | 922,8 | 925,0 | 921,0 |
| 02.07.2021 | 924,2 | 925,0 | 923,0 |
| 01.07.2021 | 923,0 | 924,0 | 922,0 |
© Bayerisches Landesamt für Umwelt 2024